Navajo vs Immigrants from Latin America In Labor Force | Age 45-54
COMPARE
Navajo
Immigrants from Latin America
In Labor Force | Age 45-54
In Labor Force | Age 45-54 Comparison
Navajo
Immigrants from Latin America
72.8%
IN LABOR FORCE | AGE 45-54
0.0/ 100
METRIC RATING
347th/ 347
METRIC RANK
81.0%
IN LABOR FORCE | AGE 45-54
0.0/ 100
METRIC RATING
280th/ 347
METRIC RANK
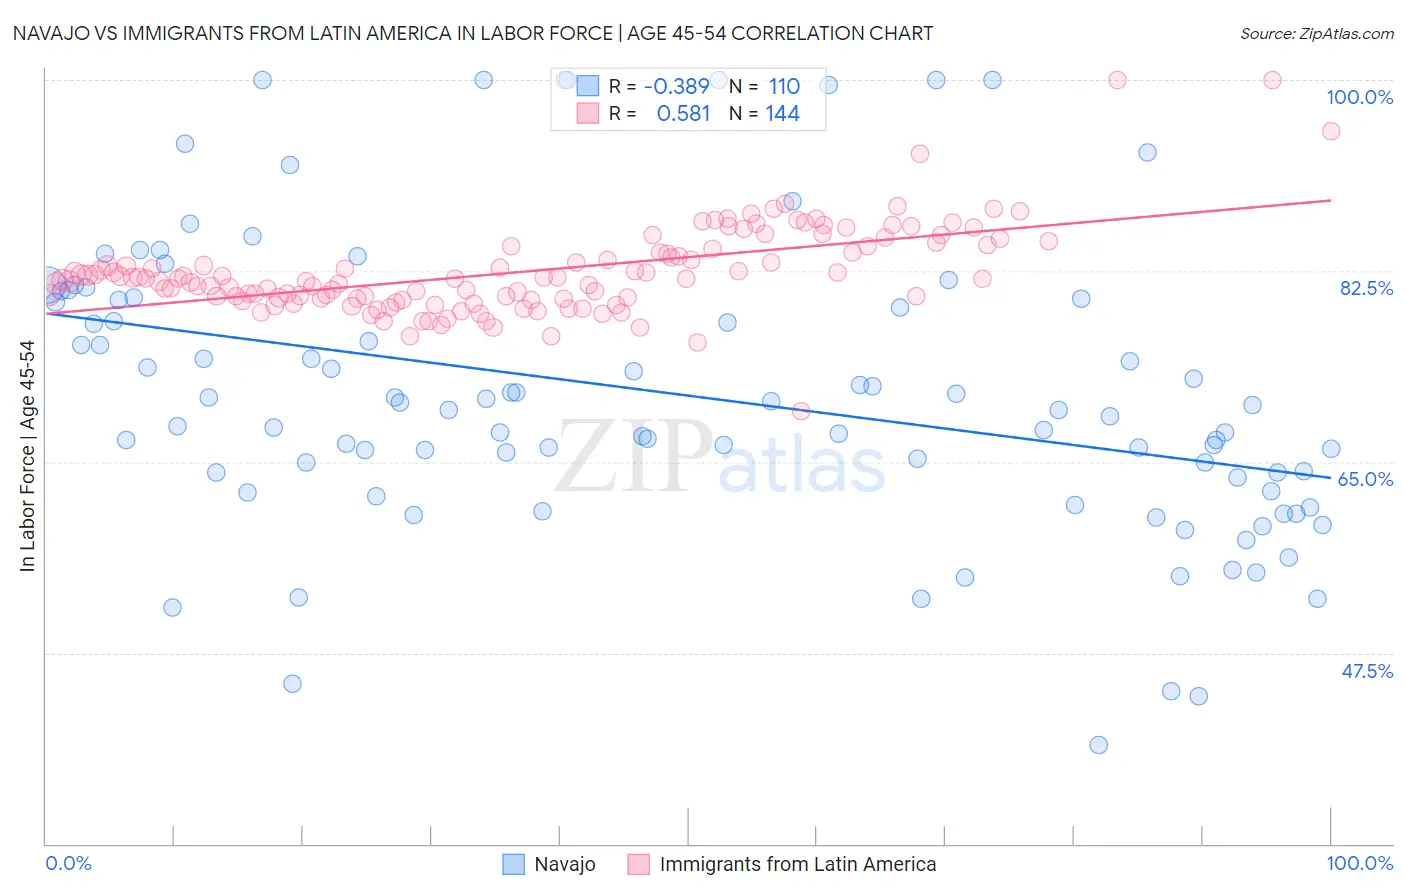
Navajo vs Immigrants from Latin America In Labor Force | Age 45-54 Correlation Chart
The statistical analysis conducted on geographies consisting of 224,749,345 people shows a mild negative correlation between the proportion of Navajo and labor force participation rate among population between the ages 45 and 54 in the United States with a correlation coefficient (R) of -0.389 and weighted average of 72.8%. Similarly, the statistical analysis conducted on geographies consisting of 557,910,063 people shows a substantial positive correlation between the proportion of Immigrants from Latin America and labor force participation rate among population between the ages 45 and 54 in the United States with a correlation coefficient (R) of 0.581 and weighted average of 81.0%, a difference of 11.3%.
In Labor Force | Age 45-54 Correlation Summary
| Measurement | Navajo | Immigrants from Latin America |
| Minimum | 39.0% | 69.6% |
| Maximum | 100.0% | 100.0% |
| Range | 61.0% | 30.4% |
| Mean | 71.2% | 82.4% |
| Median | 69.7% | 81.8% |
| Interquartile 25% (IQ1) | 63.6% | 80.0% |
| Interquartile 75% (IQ3) | 79.9% | 84.6% |
| Interquartile Range (IQR) | 16.3% | 4.6% |
| Standard Deviation (Sample) | 13.3% | 4.0% |
| Standard Deviation (Population) | 13.2% | 4.0% |
Similar Demographics by In Labor Force | Age 45-54
Demographics Similar to Navajo by In Labor Force | Age 45-54
In terms of in labor force | age 45-54, the demographic groups most similar to Navajo are Pima (72.8%, a difference of 0.050%), Houma (74.1%, a difference of 1.8%), Immigrants from Yemen (74.4%, a difference of 2.2%), Hopi (75.0%, a difference of 3.0%), and Tohono O'odham (75.1%, a difference of 3.2%).
| Demographics | Rating | Rank | In Labor Force | Age 45-54 |
| Natives/Alaskans | 0.0 /100 | #333 | Tragic 77.1% |
| Apache | 0.0 /100 | #334 | Tragic 77.1% |
| Arapaho | 0.0 /100 | #335 | Tragic 77.1% |
| Paiute | 0.0 /100 | #336 | Tragic 76.7% |
| Ute | 0.0 /100 | #337 | Tragic 76.6% |
| Yuman | 0.0 /100 | #338 | Tragic 76.3% |
| Puerto Ricans | 0.0 /100 | #339 | Tragic 75.9% |
| Lumbee | 0.0 /100 | #340 | Tragic 75.6% |
| Pueblo | 0.0 /100 | #341 | Tragic 75.5% |
| Tohono O'odham | 0.0 /100 | #342 | Tragic 75.1% |
| Hopi | 0.0 /100 | #343 | Tragic 75.0% |
| Immigrants | Yemen | 0.0 /100 | #344 | Tragic 74.4% |
| Houma | 0.0 /100 | #345 | Tragic 74.1% |
| Pima | 0.0 /100 | #346 | Tragic 72.8% |
| Navajo | 0.0 /100 | #347 | Tragic 72.8% |
Demographics Similar to Immigrants from Latin America by In Labor Force | Age 45-54
In terms of in labor force | age 45-54, the demographic groups most similar to Immigrants from Latin America are Immigrants from Grenada (81.0%, a difference of 0.0%), Aleut (81.0%, a difference of 0.070%), Immigrants from Guatemala (81.1%, a difference of 0.11%), Immigrants from Micronesia (81.1%, a difference of 0.11%), and Guatemalan (81.2%, a difference of 0.19%).
| Demographics | Rating | Rank | In Labor Force | Age 45-54 |
| Chippewa | 0.0 /100 | #273 | Tragic 81.3% |
| British West Indians | 0.0 /100 | #274 | Tragic 81.2% |
| Immigrants | Nonimmigrants | 0.0 /100 | #275 | Tragic 81.2% |
| U.S. Virgin Islanders | 0.0 /100 | #276 | Tragic 81.2% |
| Guatemalans | 0.0 /100 | #277 | Tragic 81.2% |
| Immigrants | Guatemala | 0.0 /100 | #278 | Tragic 81.1% |
| Immigrants | Micronesia | 0.0 /100 | #279 | Tragic 81.1% |
| Immigrants | Latin America | 0.0 /100 | #280 | Tragic 81.0% |
| Immigrants | Grenada | 0.0 /100 | #281 | Tragic 81.0% |
| Aleuts | 0.0 /100 | #282 | Tragic 81.0% |
| French American Indians | 0.0 /100 | #283 | Tragic 80.8% |
| Belizeans | 0.0 /100 | #284 | Tragic 80.8% |
| Delaware | 0.0 /100 | #285 | Tragic 80.8% |
| Immigrants | Dominica | 0.0 /100 | #286 | Tragic 80.8% |
| Vietnamese | 0.0 /100 | #287 | Tragic 80.8% |