Sudanese vs Hispanic or Latino In Labor Force | Age 45-54
COMPARE
Sudanese
Hispanic or Latino
In Labor Force | Age 45-54
In Labor Force | Age 45-54 Comparison
Sudanese
Hispanics or Latinos
83.0%
IN LABOR FORCE | AGE 45-54
82.0/ 100
METRIC RATING
134th/ 347
METRIC RANK
80.1%
IN LABOR FORCE | AGE 45-54
0.0/ 100
METRIC RATING
304th/ 347
METRIC RANK
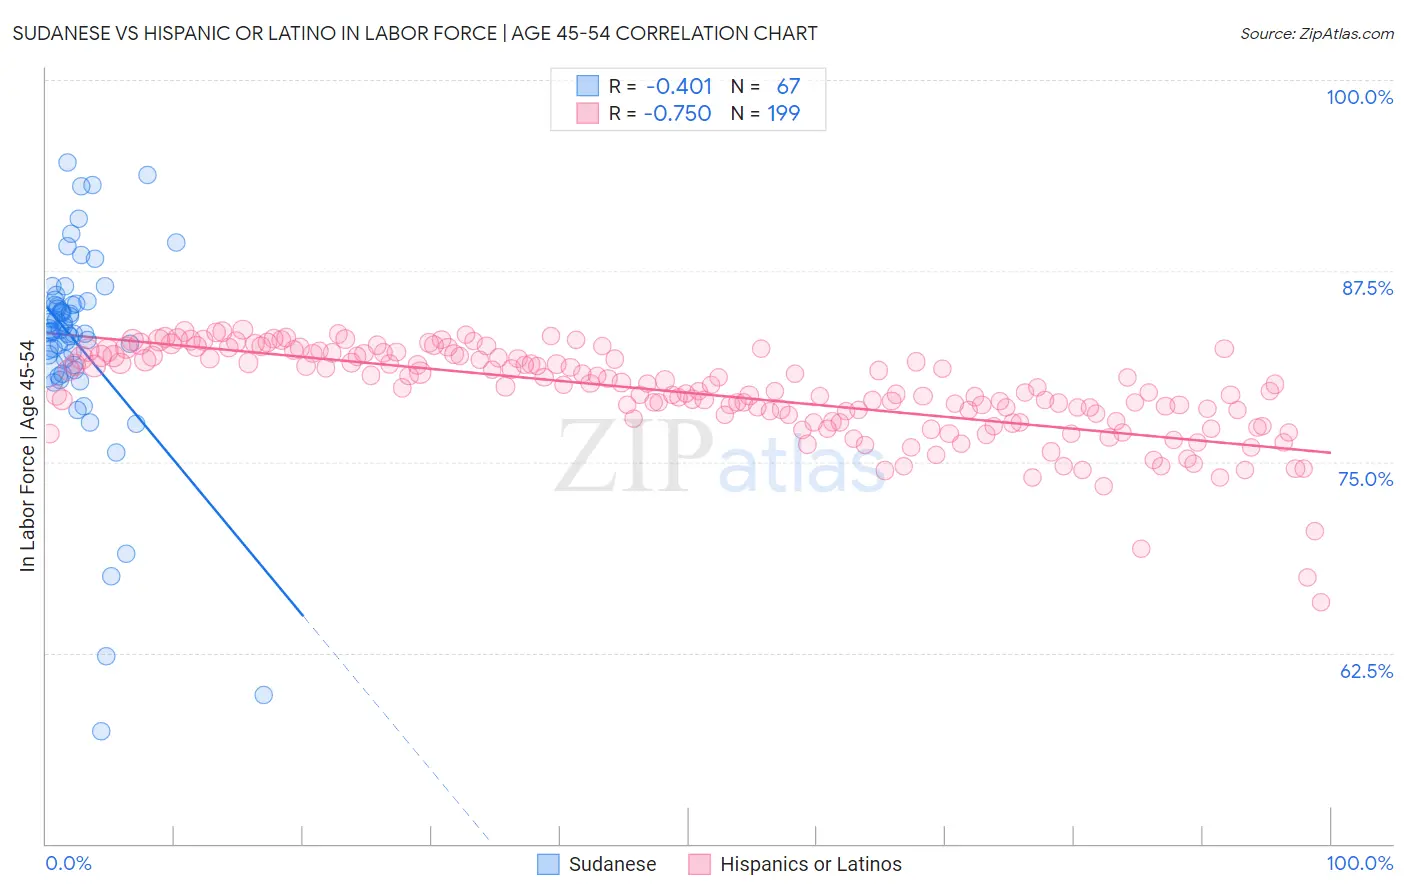
Sudanese vs Hispanic or Latino In Labor Force | Age 45-54 Correlation Chart
The statistical analysis conducted on geographies consisting of 110,102,060 people shows a moderate negative correlation between the proportion of Sudanese and labor force participation rate among population between the ages 45 and 54 in the United States with a correlation coefficient (R) of -0.401 and weighted average of 83.0%. Similarly, the statistical analysis conducted on geographies consisting of 576,352,392 people shows a strong negative correlation between the proportion of Hispanics or Latinos and labor force participation rate among population between the ages 45 and 54 in the United States with a correlation coefficient (R) of -0.750 and weighted average of 80.1%, a difference of 3.7%.
In Labor Force | Age 45-54 Correlation Summary
| Measurement | Sudanese | Hispanic or Latino |
| Minimum | 57.4% | 65.8% |
| Maximum | 94.6% | 83.7% |
| Range | 37.2% | 17.9% |
| Mean | 82.7% | 79.5% |
| Median | 83.6% | 79.8% |
| Interquartile 25% (IQ1) | 81.1% | 77.8% |
| Interquartile 75% (IQ3) | 85.4% | 81.9% |
| Interquartile Range (IQR) | 4.2% | 4.1% |
| Standard Deviation (Sample) | 6.8% | 3.0% |
| Standard Deviation (Population) | 6.8% | 3.0% |
Similar Demographics by In Labor Force | Age 45-54
Demographics Similar to Sudanese by In Labor Force | Age 45-54
In terms of in labor force | age 45-54, the demographic groups most similar to Sudanese are Immigrants from Ukraine (83.0%, a difference of 0.010%), Liberian (83.0%, a difference of 0.010%), Austrian (83.0%, a difference of 0.010%), Immigrants from Kazakhstan (83.0%, a difference of 0.010%), and Finnish (83.1%, a difference of 0.020%).
| Demographics | Rating | Rank | In Labor Force | Age 45-54 |
| Immigrants | Jordan | 85.2 /100 | #127 | Excellent 83.1% |
| Germans | 85.1 /100 | #128 | Excellent 83.1% |
| Immigrants | Northern Europe | 85.1 /100 | #129 | Excellent 83.1% |
| Immigrants | Israel | 84.7 /100 | #130 | Excellent 83.1% |
| Finns | 83.3 /100 | #131 | Excellent 83.1% |
| Immigrants | Ukraine | 82.9 /100 | #132 | Excellent 83.0% |
| Liberians | 82.7 /100 | #133 | Excellent 83.0% |
| Sudanese | 82.0 /100 | #134 | Excellent 83.0% |
| Austrians | 81.3 /100 | #135 | Excellent 83.0% |
| Immigrants | Kazakhstan | 81.0 /100 | #136 | Excellent 83.0% |
| Immigrants | Spain | 80.4 /100 | #137 | Excellent 83.0% |
| Ghanaians | 79.5 /100 | #138 | Good 83.0% |
| Scandinavians | 78.5 /100 | #139 | Good 83.0% |
| Yugoslavians | 78.3 /100 | #140 | Good 83.0% |
| Immigrants | Haiti | 77.9 /100 | #141 | Good 83.0% |
Demographics Similar to Hispanics or Latinos by In Labor Force | Age 45-54
In terms of in labor force | age 45-54, the demographic groups most similar to Hispanics or Latinos are Immigrants from Dominican Republic (80.1%, a difference of 0.010%), Immigrants from the Azores (80.1%, a difference of 0.020%), Spanish American (80.1%, a difference of 0.050%), Immigrants from Central America (80.2%, a difference of 0.090%), and Blackfeet (80.0%, a difference of 0.12%).
| Demographics | Rating | Rank | In Labor Force | Age 45-54 |
| Americans | 0.0 /100 | #297 | Tragic 80.4% |
| Marshallese | 0.0 /100 | #298 | Tragic 80.3% |
| Dominicans | 0.0 /100 | #299 | Tragic 80.3% |
| Fijians | 0.0 /100 | #300 | Tragic 80.2% |
| Spanish American Indians | 0.0 /100 | #301 | Tragic 80.2% |
| Immigrants | Central America | 0.0 /100 | #302 | Tragic 80.2% |
| Immigrants | Azores | 0.0 /100 | #303 | Tragic 80.1% |
| Hispanics or Latinos | 0.0 /100 | #304 | Tragic 80.1% |
| Immigrants | Dominican Republic | 0.0 /100 | #305 | Tragic 80.1% |
| Spanish Americans | 0.0 /100 | #306 | Tragic 80.1% |
| Blackfeet | 0.0 /100 | #307 | Tragic 80.0% |
| Central American Indians | 0.0 /100 | #308 | Tragic 80.0% |
| Potawatomi | 0.0 /100 | #309 | Tragic 80.0% |
| Inupiat | 0.0 /100 | #310 | Tragic 79.9% |
| Mexicans | 0.0 /100 | #311 | Tragic 79.8% |