Navajo vs Hispanic or Latino Professional Degree
COMPARE
Navajo
Hispanic or Latino
Professional Degree
Professional Degree Comparison
Navajo
Hispanics or Latinos
2.9%
PROFESSIONAL DEGREE
0.0/ 100
METRIC RATING
338th/ 347
METRIC RANK
3.2%
PROFESSIONAL DEGREE
0.0/ 100
METRIC RATING
322nd/ 347
METRIC RANK
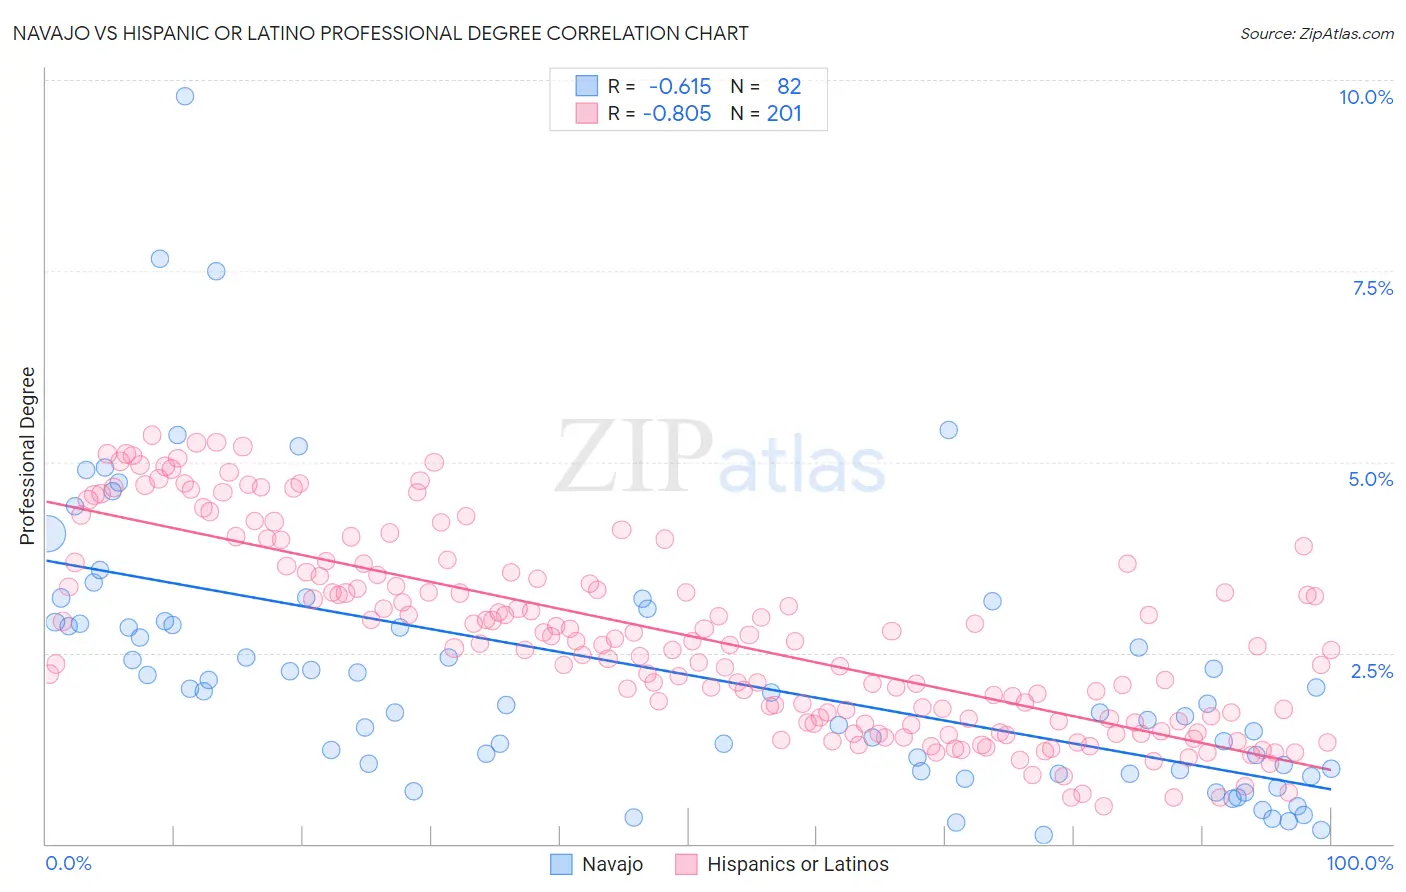
Navajo vs Hispanic or Latino Professional Degree Correlation Chart
The statistical analysis conducted on geographies consisting of 224,034,361 people shows a significant negative correlation between the proportion of Navajo and percentage of population with at least professional degree education in the United States with a correlation coefficient (R) of -0.615 and weighted average of 2.9%. Similarly, the statistical analysis conducted on geographies consisting of 568,625,989 people shows a very strong negative correlation between the proportion of Hispanics or Latinos and percentage of population with at least professional degree education in the United States with a correlation coefficient (R) of -0.805 and weighted average of 3.2%, a difference of 10.3%.
Professional Degree Correlation Summary
| Measurement | Navajo | Hispanic or Latino |
| Minimum | 0.11% | 0.49% |
| Maximum | 9.8% | 5.3% |
| Range | 9.7% | 4.9% |
| Mean | 2.3% | 2.7% |
| Median | 1.9% | 2.6% |
| Interquartile 25% (IQ1) | 0.96% | 1.6% |
| Interquartile 75% (IQ3) | 2.9% | 3.6% |
| Interquartile Range (IQR) | 1.9% | 2.0% |
| Standard Deviation (Sample) | 1.8% | 1.3% |
| Standard Deviation (Population) | 1.8% | 1.3% |
Demographics Similar to Navajo and Hispanics or Latinos by Professional Degree
In terms of professional degree, the demographic groups most similar to Navajo are Arapaho (2.9%, a difference of 0.070%), Immigrants from Central America (2.9%, a difference of 0.12%), Yup'ik (2.9%, a difference of 0.17%), Fijian (2.9%, a difference of 1.9%), and Native/Alaskan (3.0%, a difference of 2.9%). Similarly, the demographic groups most similar to Hispanics or Latinos are Inupiat (3.2%, a difference of 0.080%), Crow (3.2%, a difference of 0.35%), Tsimshian (3.2%, a difference of 0.36%), Yaqui (3.2%, a difference of 0.42%), and Seminole (3.2%, a difference of 0.72%).
| Demographics | Rating | Rank | Professional Degree |
| Seminole | 0.1 /100 | #320 | Tragic 3.2% |
| Tsimshian | 0.0 /100 | #321 | Tragic 3.2% |
| Hispanics or Latinos | 0.0 /100 | #322 | Tragic 3.2% |
| Inupiat | 0.0 /100 | #323 | Tragic 3.2% |
| Crow | 0.0 /100 | #324 | Tragic 3.2% |
| Yaqui | 0.0 /100 | #325 | Tragic 3.2% |
| Menominee | 0.0 /100 | #326 | Tragic 3.1% |
| Dutch West Indians | 0.0 /100 | #327 | Tragic 3.1% |
| Creek | 0.0 /100 | #328 | Tragic 3.1% |
| Bangladeshis | 0.0 /100 | #329 | Tragic 3.1% |
| Immigrants | Cabo Verde | 0.0 /100 | #330 | Tragic 3.1% |
| Kiowa | 0.0 /100 | #331 | Tragic 3.1% |
| Yakama | 0.0 /100 | #332 | Tragic 3.1% |
| Puget Sound Salish | 0.0 /100 | #333 | Tragic 3.1% |
| Pennsylvania Germans | 0.0 /100 | #334 | Tragic 3.0% |
| Natives/Alaskans | 0.0 /100 | #335 | Tragic 3.0% |
| Fijians | 0.0 /100 | #336 | Tragic 2.9% |
| Arapaho | 0.0 /100 | #337 | Tragic 2.9% |
| Navajo | 0.0 /100 | #338 | Tragic 2.9% |
| Immigrants | Central America | 0.0 /100 | #339 | Tragic 2.9% |
| Yup'ik | 0.0 /100 | #340 | Tragic 2.9% |