Navajo vs Immigrants from Chile In Labor Force | Age 45-54
COMPARE
Navajo
Immigrants from Chile
In Labor Force | Age 45-54
In Labor Force | Age 45-54 Comparison
Navajo
Immigrants from Chile
72.8%
IN LABOR FORCE | AGE 45-54
0.0/ 100
METRIC RATING
347th/ 347
METRIC RANK
83.2%
IN LABOR FORCE | AGE 45-54
91.6/ 100
METRIC RATING
115th/ 347
METRIC RANK
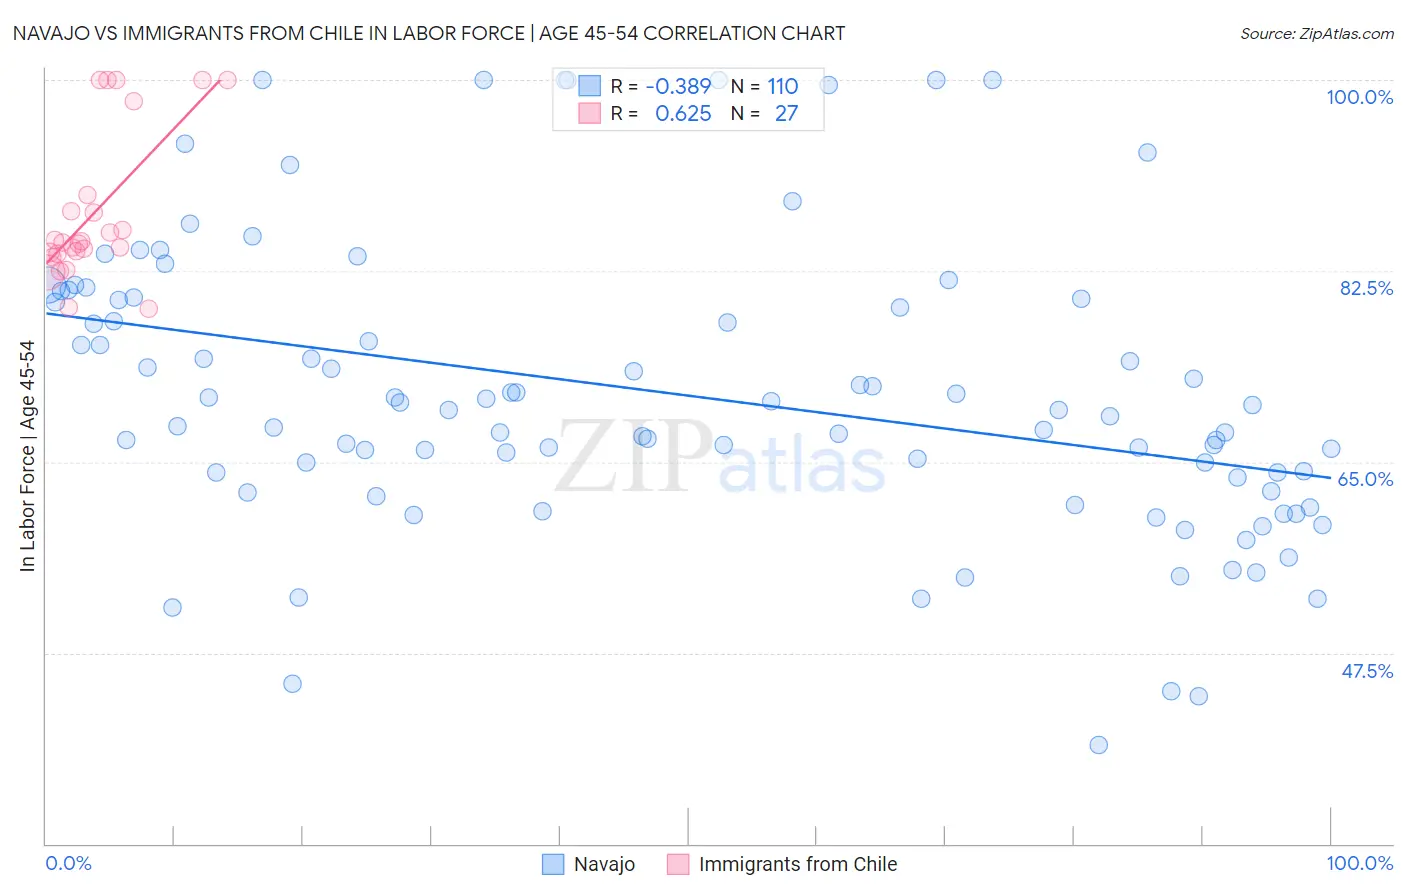
Navajo vs Immigrants from Chile In Labor Force | Age 45-54 Correlation Chart
The statistical analysis conducted on geographies consisting of 224,749,345 people shows a mild negative correlation between the proportion of Navajo and labor force participation rate among population between the ages 45 and 54 in the United States with a correlation coefficient (R) of -0.389 and weighted average of 72.8%. Similarly, the statistical analysis conducted on geographies consisting of 218,594,032 people shows a significant positive correlation between the proportion of Immigrants from Chile and labor force participation rate among population between the ages 45 and 54 in the United States with a correlation coefficient (R) of 0.625 and weighted average of 83.2%, a difference of 14.3%.
In Labor Force | Age 45-54 Correlation Summary
| Measurement | Navajo | Immigrants from Chile |
| Minimum | 39.0% | 79.0% |
| Maximum | 100.0% | 100.0% |
| Range | 61.0% | 21.0% |
| Mean | 71.2% | 87.8% |
| Median | 69.7% | 85.1% |
| Interquartile 25% (IQ1) | 63.6% | 84.1% |
| Interquartile 75% (IQ3) | 79.9% | 89.5% |
| Interquartile Range (IQR) | 16.3% | 5.4% |
| Standard Deviation (Sample) | 13.3% | 6.8% |
| Standard Deviation (Population) | 13.2% | 6.7% |
Similar Demographics by In Labor Force | Age 45-54
Demographics Similar to Navajo by In Labor Force | Age 45-54
In terms of in labor force | age 45-54, the demographic groups most similar to Navajo are Pima (72.8%, a difference of 0.050%), Houma (74.1%, a difference of 1.8%), Immigrants from Yemen (74.4%, a difference of 2.2%), Hopi (75.0%, a difference of 3.0%), and Tohono O'odham (75.1%, a difference of 3.2%).
| Demographics | Rating | Rank | In Labor Force | Age 45-54 |
| Natives/Alaskans | 0.0 /100 | #333 | Tragic 77.1% |
| Apache | 0.0 /100 | #334 | Tragic 77.1% |
| Arapaho | 0.0 /100 | #335 | Tragic 77.1% |
| Paiute | 0.0 /100 | #336 | Tragic 76.7% |
| Ute | 0.0 /100 | #337 | Tragic 76.6% |
| Yuman | 0.0 /100 | #338 | Tragic 76.3% |
| Puerto Ricans | 0.0 /100 | #339 | Tragic 75.9% |
| Lumbee | 0.0 /100 | #340 | Tragic 75.6% |
| Pueblo | 0.0 /100 | #341 | Tragic 75.5% |
| Tohono O'odham | 0.0 /100 | #342 | Tragic 75.1% |
| Hopi | 0.0 /100 | #343 | Tragic 75.0% |
| Immigrants | Yemen | 0.0 /100 | #344 | Tragic 74.4% |
| Houma | 0.0 /100 | #345 | Tragic 74.1% |
| Pima | 0.0 /100 | #346 | Tragic 72.8% |
| Navajo | 0.0 /100 | #347 | Tragic 72.8% |
Demographics Similar to Immigrants from Chile by In Labor Force | Age 45-54
In terms of in labor force | age 45-54, the demographic groups most similar to Immigrants from Chile are Assyrian/Chaldean/Syriac (83.2%, a difference of 0.0%), Immigrants from Malaysia (83.2%, a difference of 0.0%), Immigrants from Albania (83.2%, a difference of 0.010%), Immigrants from Afghanistan (83.2%, a difference of 0.020%), and Immigrants from China (83.2%, a difference of 0.020%).
| Demographics | Rating | Rank | In Labor Force | Age 45-54 |
| Slovaks | 92.8 /100 | #108 | Exceptional 83.2% |
| Ukrainians | 92.7 /100 | #109 | Exceptional 83.2% |
| Immigrants | Africa | 92.6 /100 | #110 | Exceptional 83.2% |
| Immigrants | Italy | 92.5 /100 | #111 | Exceptional 83.2% |
| Immigrants | Afghanistan | 92.4 /100 | #112 | Exceptional 83.2% |
| Immigrants | Albania | 91.8 /100 | #113 | Exceptional 83.2% |
| Assyrians/Chaldeans/Syriacs | 91.7 /100 | #114 | Exceptional 83.2% |
| Immigrants | Chile | 91.6 /100 | #115 | Exceptional 83.2% |
| Immigrants | Malaysia | 91.4 /100 | #116 | Exceptional 83.2% |
| Immigrants | China | 90.9 /100 | #117 | Exceptional 83.2% |
| Immigrants | Europe | 90.7 /100 | #118 | Exceptional 83.2% |
| Immigrants | Uruguay | 90.2 /100 | #119 | Exceptional 83.2% |
| Immigrants | Russia | 90.1 /100 | #120 | Exceptional 83.2% |
| Uruguayans | 89.4 /100 | #121 | Excellent 83.1% |
| Immigrants | Vietnam | 88.9 /100 | #122 | Excellent 83.1% |