Cree vs Cypriot In Labor Force | Age 30-34
COMPARE
Cree
Cypriot
In Labor Force | Age 30-34
In Labor Force | Age 30-34 Comparison
Cree
Cypriots
83.2%
IN LABOR FORCE | AGE 30-34
0.0/ 100
METRIC RATING
285th/ 347
METRIC RANK
85.8%
IN LABOR FORCE | AGE 30-34
99.9/ 100
METRIC RATING
32nd/ 347
METRIC RANK
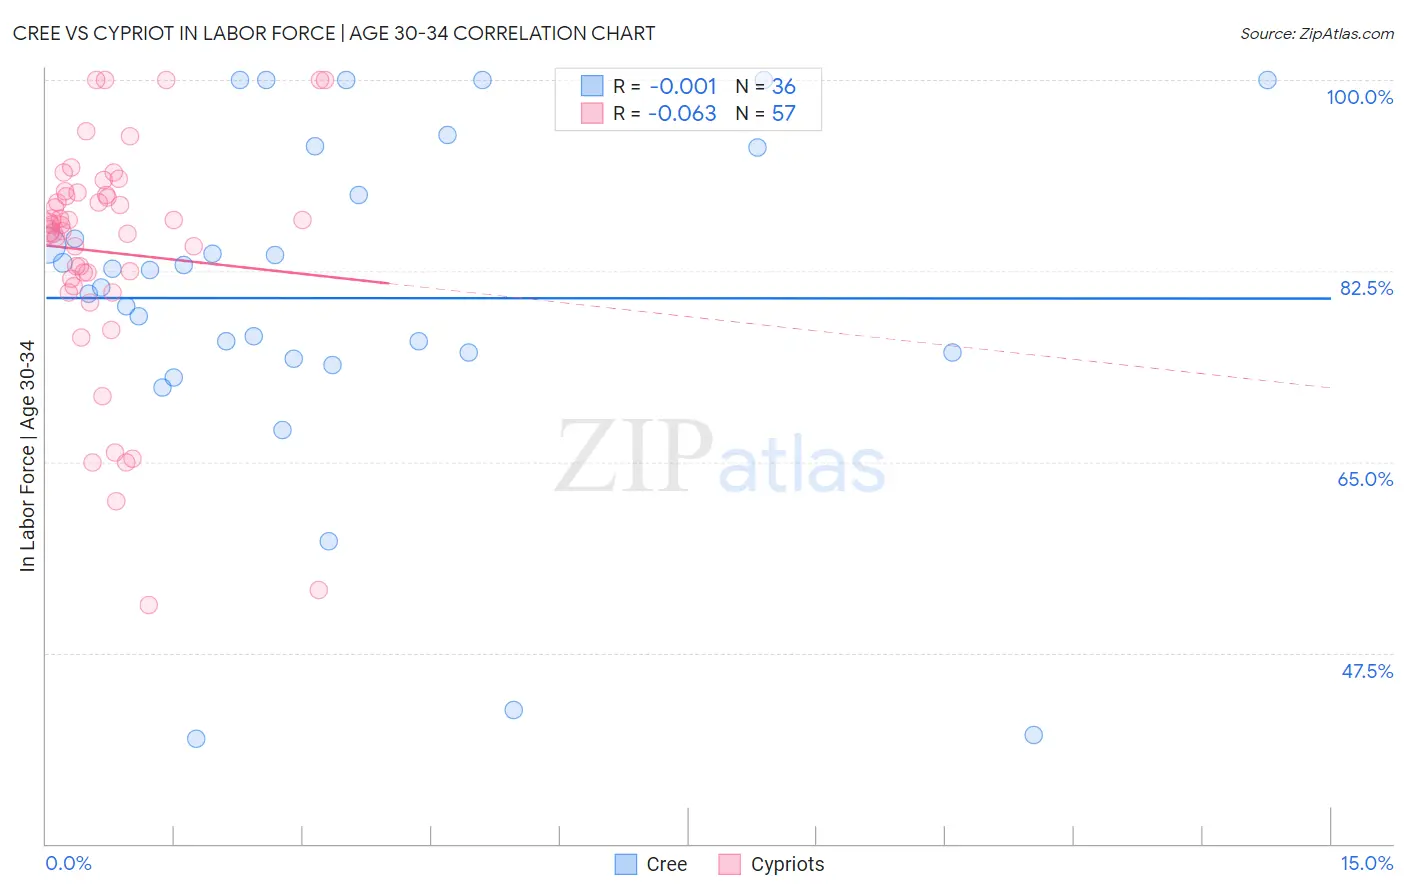
Cree vs Cypriot In Labor Force | Age 30-34 Correlation Chart
The statistical analysis conducted on geographies consisting of 76,199,650 people shows no correlation between the proportion of Cree and labor force participation rate among population between the ages 30 and 34 in the United States with a correlation coefficient (R) of -0.001 and weighted average of 83.2%. Similarly, the statistical analysis conducted on geographies consisting of 61,842,165 people shows a slight negative correlation between the proportion of Cypriots and labor force participation rate among population between the ages 30 and 34 in the United States with a correlation coefficient (R) of -0.063 and weighted average of 85.8%, a difference of 3.2%.
In Labor Force | Age 30-34 Correlation Summary
| Measurement | Cree | Cypriot |
| Minimum | 39.6% | 51.9% |
| Maximum | 100.0% | 100.0% |
| Range | 60.4% | 48.1% |
| Mean | 80.0% | 84.2% |
| Median | 81.8% | 86.7% |
| Interquartile 25% (IQ1) | 74.7% | 81.4% |
| Interquartile 75% (IQ3) | 91.7% | 89.6% |
| Interquartile Range (IQR) | 17.0% | 8.1% |
| Standard Deviation (Sample) | 15.9% | 10.7% |
| Standard Deviation (Population) | 15.6% | 10.6% |
Similar Demographics by In Labor Force | Age 30-34
Demographics Similar to Cree by In Labor Force | Age 30-34
In terms of in labor force | age 30-34, the demographic groups most similar to Cree are Immigrants from Belize (83.2%, a difference of 0.0%), Assyrian/Chaldean/Syriac (83.2%, a difference of 0.050%), Immigrants from Latin America (83.1%, a difference of 0.060%), Mexican American Indian (83.2%, a difference of 0.070%), and Samoan (83.3%, a difference of 0.10%).
| Demographics | Rating | Rank | In Labor Force | Age 30-34 |
| Fijians | 0.0 /100 | #278 | Tragic 83.4% |
| Immigrants | Fiji | 0.0 /100 | #279 | Tragic 83.4% |
| Africans | 0.0 /100 | #280 | Tragic 83.4% |
| Samoans | 0.0 /100 | #281 | Tragic 83.3% |
| Mexican American Indians | 0.0 /100 | #282 | Tragic 83.2% |
| Assyrians/Chaldeans/Syriacs | 0.0 /100 | #283 | Tragic 83.2% |
| Immigrants | Belize | 0.0 /100 | #284 | Tragic 83.2% |
| Cree | 0.0 /100 | #285 | Tragic 83.2% |
| Immigrants | Latin America | 0.0 /100 | #286 | Tragic 83.1% |
| Native Hawaiians | 0.0 /100 | #287 | Tragic 83.0% |
| Central American Indians | 0.0 /100 | #288 | Tragic 83.0% |
| Hawaiians | 0.0 /100 | #289 | Tragic 83.0% |
| Blackfeet | 0.0 /100 | #290 | Tragic 82.8% |
| Potawatomi | 0.0 /100 | #291 | Tragic 82.8% |
| Blacks/African Americans | 0.0 /100 | #292 | Tragic 82.8% |
Demographics Similar to Cypriots by In Labor Force | Age 30-34
In terms of in labor force | age 30-34, the demographic groups most similar to Cypriots are Paraguayan (85.8%, a difference of 0.0%), Immigrants from Hong Kong (85.8%, a difference of 0.020%), Immigrants from Bosnia and Herzegovina (85.8%, a difference of 0.040%), Ugandan (85.8%, a difference of 0.050%), and Serbian (85.8%, a difference of 0.050%).
| Demographics | Rating | Rank | In Labor Force | Age 30-34 |
| Immigrants | North Macedonia | 100.0 /100 | #25 | Exceptional 85.9% |
| Immigrants | Eastern Africa | 100.0 /100 | #26 | Exceptional 85.9% |
| Immigrants | Liberia | 100.0 /100 | #27 | Exceptional 85.9% |
| Immigrants | Latvia | 100.0 /100 | #28 | Exceptional 85.9% |
| Tsimshian | 100.0 /100 | #29 | Exceptional 85.8% |
| Immigrants | Hong Kong | 100.0 /100 | #30 | Exceptional 85.8% |
| Paraguayans | 99.9 /100 | #31 | Exceptional 85.8% |
| Cypriots | 99.9 /100 | #32 | Exceptional 85.8% |
| Immigrants | Bosnia and Herzegovina | 99.9 /100 | #33 | Exceptional 85.8% |
| Ugandans | 99.9 /100 | #34 | Exceptional 85.8% |
| Serbians | 99.9 /100 | #35 | Exceptional 85.8% |
| Albanians | 99.9 /100 | #36 | Exceptional 85.7% |
| Norwegians | 99.9 /100 | #37 | Exceptional 85.7% |
| Immigrants | Greece | 99.9 /100 | #38 | Exceptional 85.7% |
| Eastern Europeans | 99.9 /100 | #39 | Exceptional 85.7% |