Navajo vs Cypriot 2nd Grade
COMPARE
Navajo
Cypriot
2nd Grade
2nd Grade Comparison
Navajo
Cypriots
97.9%
2ND GRADE
54.3/ 100
METRIC RATING
170th/ 347
METRIC RANK
98.2%
2ND GRADE
98.4/ 100
METRIC RATING
96th/ 347
METRIC RANK
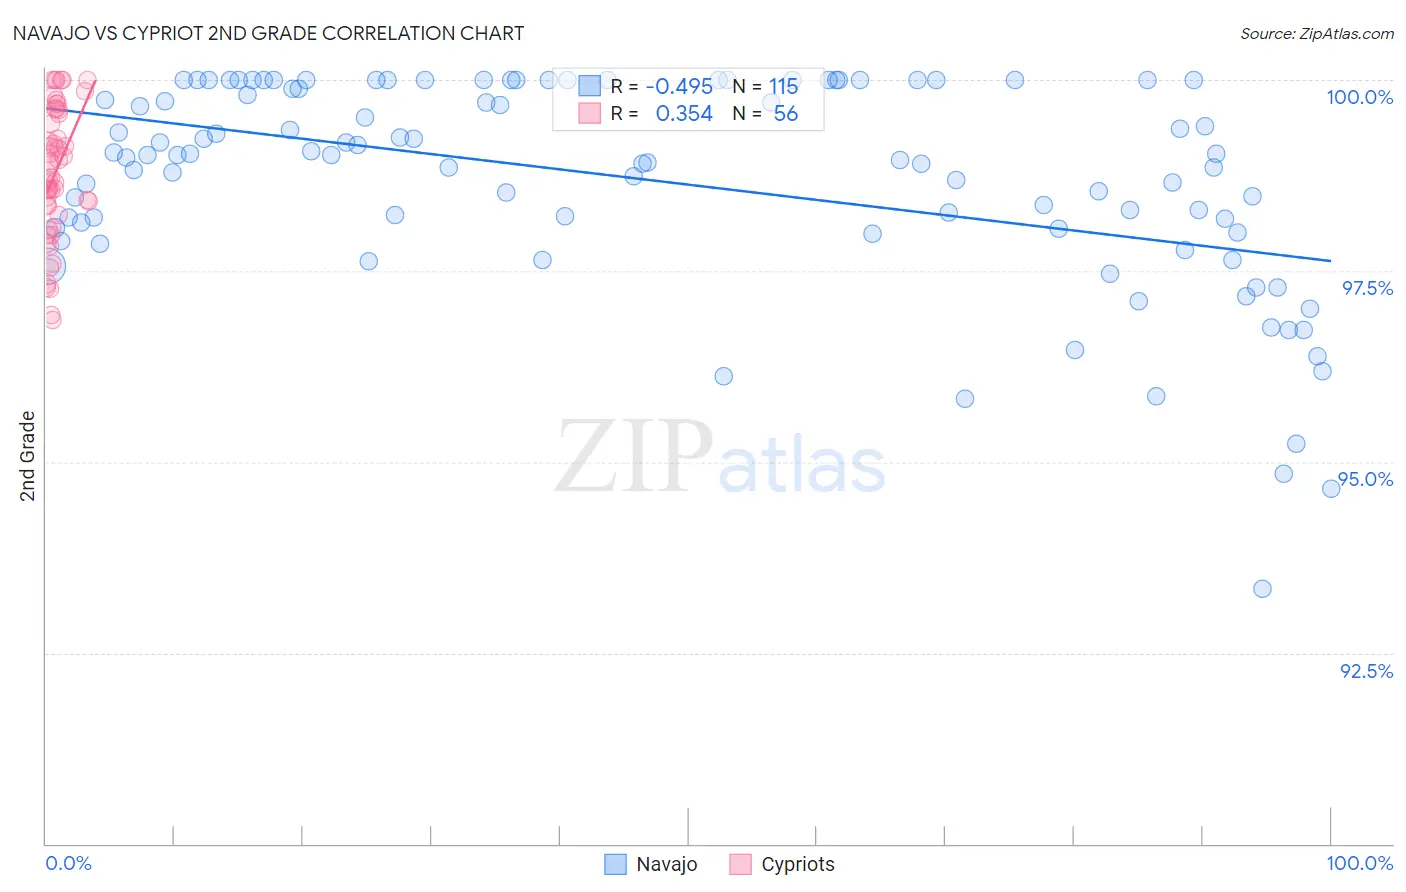
Navajo vs Cypriot 2nd Grade Correlation Chart
The statistical analysis conducted on geographies consisting of 224,872,493 people shows a moderate negative correlation between the proportion of Navajo and percentage of population with at least 2nd grade education in the United States with a correlation coefficient (R) of -0.495 and weighted average of 97.9%. Similarly, the statistical analysis conducted on geographies consisting of 61,867,249 people shows a mild positive correlation between the proportion of Cypriots and percentage of population with at least 2nd grade education in the United States with a correlation coefficient (R) of 0.354 and weighted average of 98.2%, a difference of 0.31%.
2nd Grade Correlation Summary
| Measurement | Navajo | Cypriot |
| Minimum | 93.3% | 96.9% |
| Maximum | 100.0% | 100.0% |
| Range | 6.7% | 3.1% |
| Mean | 98.7% | 98.8% |
| Median | 99.0% | 98.8% |
| Interquartile 25% (IQ1) | 98.0% | 98.3% |
| Interquartile 75% (IQ3) | 100.0% | 99.6% |
| Interquartile Range (IQR) | 2.0% | 1.3% |
| Standard Deviation (Sample) | 1.4% | 0.85% |
| Standard Deviation (Population) | 1.4% | 0.85% |
Similar Demographics by 2nd Grade
Demographics Similar to Navajo by 2nd Grade
In terms of 2nd grade, the demographic groups most similar to Navajo are Brazilian (97.9%, a difference of 0.0%), Immigrants from Spain (97.9%, a difference of 0.0%), Albanian (97.9%, a difference of 0.0%), Ugandan (97.9%, a difference of 0.010%), and Spanish American (97.9%, a difference of 0.010%).
| Demographics | Rating | Rank | 2nd Grade |
| Bermudans | 59.4 /100 | #163 | Average 97.9% |
| Ugandans | 56.6 /100 | #164 | Average 97.9% |
| Spanish Americans | 56.4 /100 | #165 | Average 97.9% |
| Immigrants | Jordan | 56.3 /100 | #166 | Average 97.9% |
| Chileans | 56.1 /100 | #167 | Average 97.9% |
| Brazilians | 55.8 /100 | #168 | Average 97.9% |
| Immigrants | Spain | 55.4 /100 | #169 | Average 97.9% |
| Navajo | 54.3 /100 | #170 | Average 97.9% |
| Albanians | 52.8 /100 | #171 | Average 97.9% |
| Immigrants | Korea | 52.7 /100 | #172 | Average 97.9% |
| Kenyans | 52.7 /100 | #173 | Average 97.9% |
| Immigrants | Micronesia | 50.0 /100 | #174 | Average 97.9% |
| Immigrants | Bosnia and Herzegovina | 49.8 /100 | #175 | Average 97.9% |
| Immigrants | Sri Lanka | 48.7 /100 | #176 | Average 97.9% |
| Immigrants | Brazil | 46.6 /100 | #177 | Average 97.9% |
Demographics Similar to Cypriots by 2nd Grade
In terms of 2nd grade, the demographic groups most similar to Cypriots are Immigrants from Germany (98.2%, a difference of 0.010%), South African (98.2%, a difference of 0.010%), Choctaw (98.2%, a difference of 0.010%), Nonimmigrants (98.2%, a difference of 0.010%), and Zimbabwean (98.2%, a difference of 0.020%).
| Demographics | Rating | Rank | 2nd Grade |
| Ukrainians | 98.9 /100 | #89 | Exceptional 98.2% |
| Zimbabweans | 98.8 /100 | #90 | Exceptional 98.2% |
| Immigrants | Western Europe | 98.8 /100 | #91 | Exceptional 98.2% |
| Immigrants | South Africa | 98.8 /100 | #92 | Exceptional 98.2% |
| Immigrants | India | 98.8 /100 | #93 | Exceptional 98.2% |
| Immigrants | Germany | 98.6 /100 | #94 | Exceptional 98.2% |
| South Africans | 98.6 /100 | #95 | Exceptional 98.2% |
| Cypriots | 98.4 /100 | #96 | Exceptional 98.2% |
| Choctaw | 98.3 /100 | #97 | Exceptional 98.2% |
| Immigrants | Nonimmigrants | 98.3 /100 | #98 | Exceptional 98.2% |
| Immigrants | Ireland | 98.0 /100 | #99 | Exceptional 98.2% |
| Romanians | 98.0 /100 | #100 | Exceptional 98.2% |
| Puget Sound Salish | 98.0 /100 | #101 | Exceptional 98.2% |
| Cree | 98.0 /100 | #102 | Exceptional 98.2% |
| Pima | 97.6 /100 | #103 | Exceptional 98.2% |