Immigrants from Asia vs Cypriot In Labor Force | Age 30-34
COMPARE
Immigrants from Asia
Cypriot
In Labor Force | Age 30-34
In Labor Force | Age 30-34 Comparison
Immigrants from Asia
Cypriots
85.0%
IN LABOR FORCE | AGE 30-34
88.9/ 100
METRIC RATING
135th/ 347
METRIC RANK
85.8%
IN LABOR FORCE | AGE 30-34
99.9/ 100
METRIC RATING
32nd/ 347
METRIC RANK
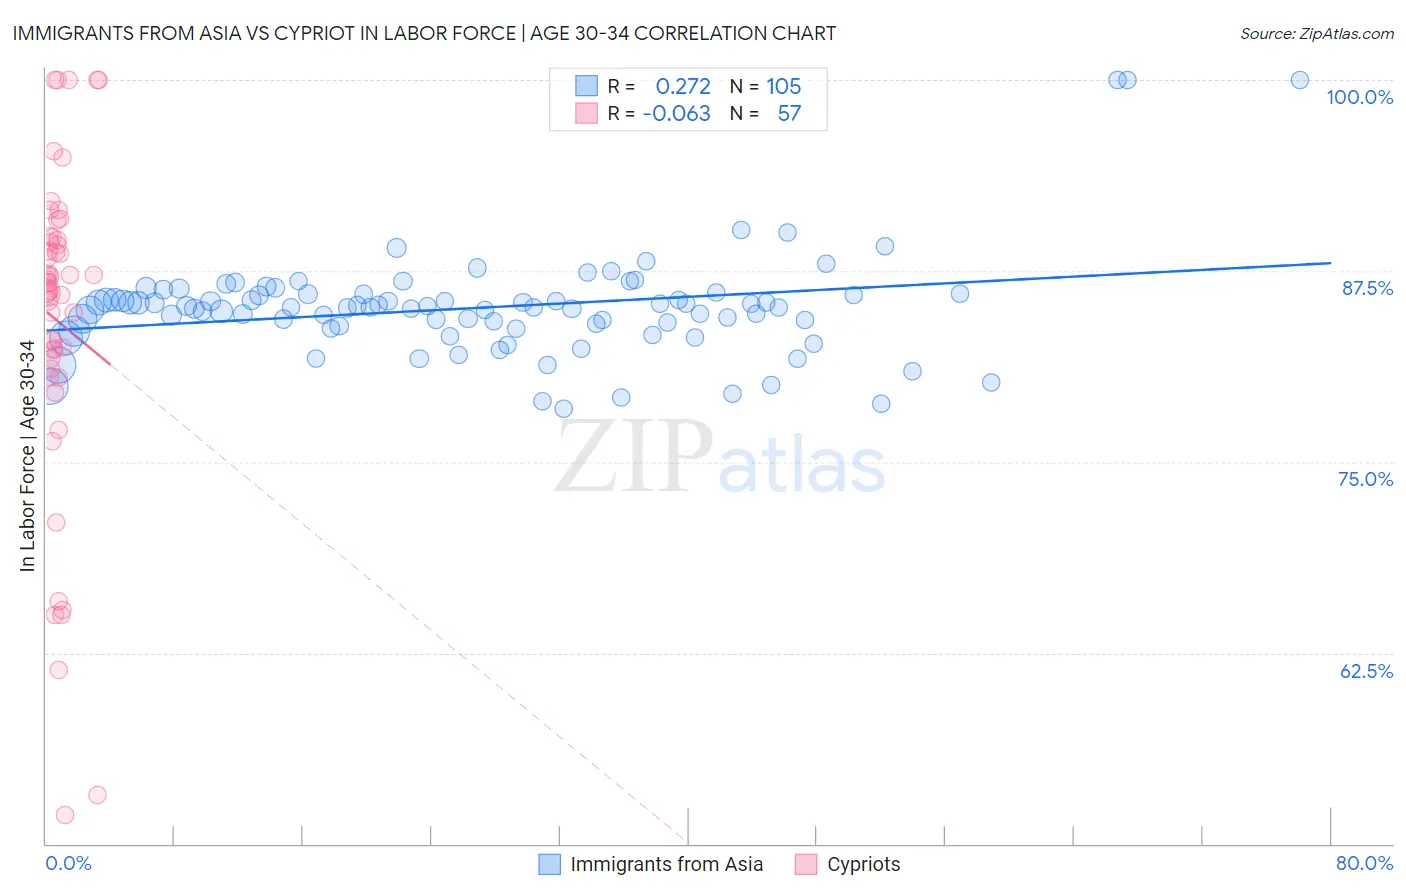
Immigrants from Asia vs Cypriot In Labor Force | Age 30-34 Correlation Chart
The statistical analysis conducted on geographies consisting of 548,380,384 people shows a weak positive correlation between the proportion of Immigrants from Asia and labor force participation rate among population between the ages 30 and 34 in the United States with a correlation coefficient (R) of 0.272 and weighted average of 85.0%. Similarly, the statistical analysis conducted on geographies consisting of 61,842,165 people shows a slight negative correlation between the proportion of Cypriots and labor force participation rate among population between the ages 30 and 34 in the United States with a correlation coefficient (R) of -0.063 and weighted average of 85.8%, a difference of 0.95%.
In Labor Force | Age 30-34 Correlation Summary
| Measurement | Immigrants from Asia | Cypriot |
| Minimum | 78.5% | 51.9% |
| Maximum | 100.0% | 100.0% |
| Range | 21.5% | 48.1% |
| Mean | 85.1% | 84.2% |
| Median | 85.1% | 86.7% |
| Interquartile 25% (IQ1) | 83.8% | 81.4% |
| Interquartile 75% (IQ3) | 86.0% | 89.6% |
| Interquartile Range (IQR) | 2.2% | 8.1% |
| Standard Deviation (Sample) | 3.4% | 10.7% |
| Standard Deviation (Population) | 3.4% | 10.6% |
Similar Demographics by In Labor Force | Age 30-34
Demographics Similar to Immigrants from Asia by In Labor Force | Age 30-34
In terms of in labor force | age 30-34, the demographic groups most similar to Immigrants from Asia are Immigrants from Chile (85.0%, a difference of 0.0%), Chinese (85.0%, a difference of 0.010%), Immigrants from Israel (85.0%, a difference of 0.010%), New Zealander (85.0%, a difference of 0.010%), and Jordanian (85.0%, a difference of 0.010%).
| Demographics | Rating | Rank | In Labor Force | Age 30-34 |
| Immigrants | Argentina | 90.6 /100 | #128 | Exceptional 85.0% |
| Immigrants | Western Africa | 90.2 /100 | #129 | Exceptional 85.0% |
| Immigrants | Spain | 90.0 /100 | #130 | Exceptional 85.0% |
| Chinese | 89.6 /100 | #131 | Excellent 85.0% |
| Immigrants | Israel | 89.5 /100 | #132 | Excellent 85.0% |
| New Zealanders | 89.5 /100 | #133 | Excellent 85.0% |
| Immigrants | Chile | 89.2 /100 | #134 | Excellent 85.0% |
| Immigrants | Asia | 88.9 /100 | #135 | Excellent 85.0% |
| Jordanians | 88.6 /100 | #136 | Excellent 85.0% |
| South Africans | 88.0 /100 | #137 | Excellent 85.0% |
| Sri Lankans | 87.8 /100 | #138 | Excellent 85.0% |
| Bhutanese | 87.5 /100 | #139 | Excellent 85.0% |
| Immigrants | Vietnam | 86.5 /100 | #140 | Excellent 85.0% |
| Chileans | 85.3 /100 | #141 | Excellent 84.9% |
| Immigrants | Indonesia | 84.3 /100 | #142 | Excellent 84.9% |
Demographics Similar to Cypriots by In Labor Force | Age 30-34
In terms of in labor force | age 30-34, the demographic groups most similar to Cypriots are Paraguayan (85.8%, a difference of 0.0%), Immigrants from Hong Kong (85.8%, a difference of 0.020%), Immigrants from Bosnia and Herzegovina (85.8%, a difference of 0.040%), Ugandan (85.8%, a difference of 0.050%), and Serbian (85.8%, a difference of 0.050%).
| Demographics | Rating | Rank | In Labor Force | Age 30-34 |
| Immigrants | North Macedonia | 100.0 /100 | #25 | Exceptional 85.9% |
| Immigrants | Eastern Africa | 100.0 /100 | #26 | Exceptional 85.9% |
| Immigrants | Liberia | 100.0 /100 | #27 | Exceptional 85.9% |
| Immigrants | Latvia | 100.0 /100 | #28 | Exceptional 85.9% |
| Tsimshian | 100.0 /100 | #29 | Exceptional 85.8% |
| Immigrants | Hong Kong | 100.0 /100 | #30 | Exceptional 85.8% |
| Paraguayans | 99.9 /100 | #31 | Exceptional 85.8% |
| Cypriots | 99.9 /100 | #32 | Exceptional 85.8% |
| Immigrants | Bosnia and Herzegovina | 99.9 /100 | #33 | Exceptional 85.8% |
| Ugandans | 99.9 /100 | #34 | Exceptional 85.8% |
| Serbians | 99.9 /100 | #35 | Exceptional 85.8% |
| Albanians | 99.9 /100 | #36 | Exceptional 85.7% |
| Norwegians | 99.9 /100 | #37 | Exceptional 85.7% |
| Immigrants | Greece | 99.9 /100 | #38 | Exceptional 85.7% |
| Eastern Europeans | 99.9 /100 | #39 | Exceptional 85.7% |