South American Indian vs Basque In Labor Force | Age 30-34
COMPARE
South American Indian
Basque
In Labor Force | Age 30-34
In Labor Force | Age 30-34 Comparison
South American Indians
Basques
84.7%
IN LABOR FORCE | AGE 30-34
52.1/ 100
METRIC RATING
169th/ 347
METRIC RANK
84.0%
IN LABOR FORCE | AGE 30-34
0.9/ 100
METRIC RATING
244th/ 347
METRIC RANK
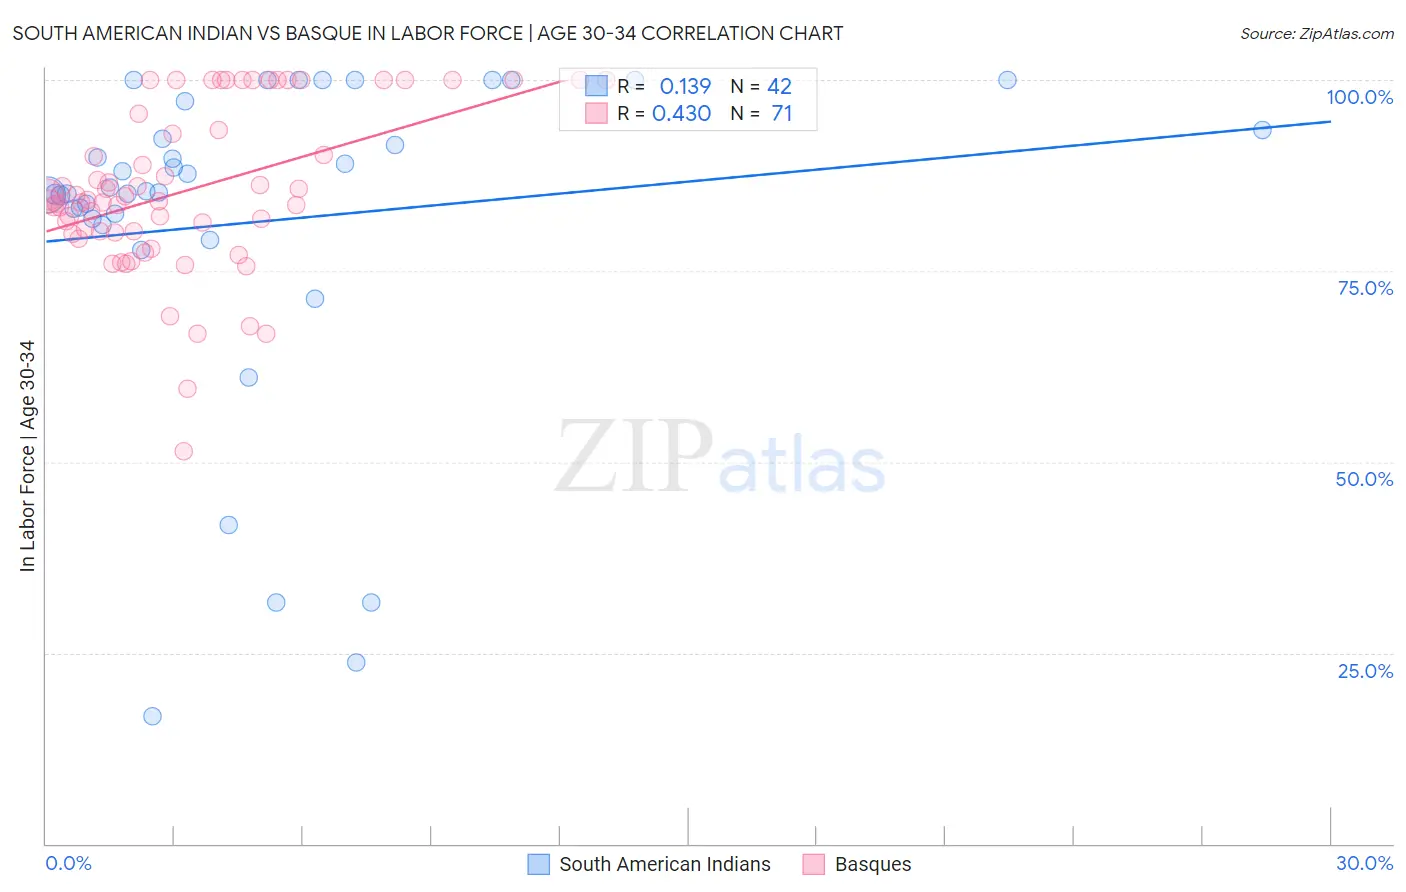
South American Indian vs Basque In Labor Force | Age 30-34 Correlation Chart
The statistical analysis conducted on geographies consisting of 164,535,874 people shows a poor positive correlation between the proportion of South American Indians and labor force participation rate among population between the ages 30 and 34 in the United States with a correlation coefficient (R) of 0.139 and weighted average of 84.7%. Similarly, the statistical analysis conducted on geographies consisting of 165,739,384 people shows a moderate positive correlation between the proportion of Basques and labor force participation rate among population between the ages 30 and 34 in the United States with a correlation coefficient (R) of 0.430 and weighted average of 84.0%, a difference of 0.84%.
In Labor Force | Age 30-34 Correlation Summary
| Measurement | South American Indian | Basque |
| Minimum | 16.7% | 51.4% |
| Maximum | 100.0% | 100.0% |
| Range | 83.3% | 48.6% |
| Mean | 81.4% | 85.6% |
| Median | 85.3% | 84.2% |
| Interquartile 25% (IQ1) | 81.8% | 80.1% |
| Interquartile 75% (IQ3) | 93.5% | 95.5% |
| Interquartile Range (IQR) | 11.7% | 15.4% |
| Standard Deviation (Sample) | 21.4% | 10.7% |
| Standard Deviation (Population) | 21.1% | 10.6% |
Similar Demographics by In Labor Force | Age 30-34
Demographics Similar to South American Indians by In Labor Force | Age 30-34
In terms of in labor force | age 30-34, the demographic groups most similar to South American Indians are Immigrants from Peru (84.7%, a difference of 0.0%), Immigrants from Burma/Myanmar (84.7%, a difference of 0.0%), Irish (84.7%, a difference of 0.0%), Immigrants from England (84.7%, a difference of 0.0%), and Immigrants from South Eastern Asia (84.7%, a difference of 0.010%).
| Demographics | Rating | Rank | In Labor Force | Age 30-34 |
| South Americans | 58.7 /100 | #162 | Average 84.7% |
| Immigrants | Uruguay | 57.4 /100 | #163 | Average 84.7% |
| Icelanders | 56.8 /100 | #164 | Average 84.7% |
| Immigrants | Western Europe | 56.7 /100 | #165 | Average 84.7% |
| Afghans | 55.2 /100 | #166 | Average 84.7% |
| Immigrants | South Eastern Asia | 54.2 /100 | #167 | Average 84.7% |
| Immigrants | Peru | 52.4 /100 | #168 | Average 84.7% |
| South American Indians | 52.1 /100 | #169 | Average 84.7% |
| Immigrants | Burma/Myanmar | 52.0 /100 | #170 | Average 84.7% |
| Irish | 52.0 /100 | #171 | Average 84.7% |
| Immigrants | England | 51.7 /100 | #172 | Average 84.7% |
| Israelis | 51.1 /100 | #173 | Average 84.7% |
| Finns | 50.0 /100 | #174 | Average 84.7% |
| Immigrants | South America | 50.0 /100 | #175 | Average 84.7% |
| Immigrants | Uzbekistan | 49.1 /100 | #176 | Average 84.7% |
Demographics Similar to Basques by In Labor Force | Age 30-34
In terms of in labor force | age 30-34, the demographic groups most similar to Basques are Immigrants from Venezuela (84.0%, a difference of 0.0%), Central American (84.0%, a difference of 0.0%), British West Indian (84.0%, a difference of 0.020%), Immigrants from Caribbean (84.0%, a difference of 0.030%), and Portuguese (84.0%, a difference of 0.030%).
| Demographics | Rating | Rank | In Labor Force | Age 30-34 |
| Celtics | 1.4 /100 | #237 | Tragic 84.1% |
| Immigrants | Barbados | 1.4 /100 | #238 | Tragic 84.0% |
| English | 1.4 /100 | #239 | Tragic 84.0% |
| Venezuelans | 1.3 /100 | #240 | Tragic 84.0% |
| Immigrants | Portugal | 1.2 /100 | #241 | Tragic 84.0% |
| Immigrants | Oceania | 1.1 /100 | #242 | Tragic 84.0% |
| Immigrants | Caribbean | 1.1 /100 | #243 | Tragic 84.0% |
| Basques | 0.9 /100 | #244 | Tragic 84.0% |
| Immigrants | Venezuela | 0.9 /100 | #245 | Tragic 84.0% |
| Central Americans | 0.9 /100 | #246 | Tragic 84.0% |
| British West Indians | 0.8 /100 | #247 | Tragic 84.0% |
| Portuguese | 0.8 /100 | #248 | Tragic 84.0% |
| Immigrants | Dominica | 0.7 /100 | #249 | Tragic 84.0% |
| Immigrants | Iraq | 0.7 /100 | #250 | Tragic 83.9% |
| Nicaraguans | 0.6 /100 | #251 | Tragic 83.9% |