Pennsylvania German vs Basque In Labor Force | Age 30-34
COMPARE
Pennsylvania German
Basque
In Labor Force | Age 30-34
In Labor Force | Age 30-34 Comparison
Pennsylvania Germans
Basques
82.6%
IN LABOR FORCE | AGE 30-34
0.0/ 100
METRIC RATING
295th/ 347
METRIC RANK
84.0%
IN LABOR FORCE | AGE 30-34
0.9/ 100
METRIC RATING
244th/ 347
METRIC RANK
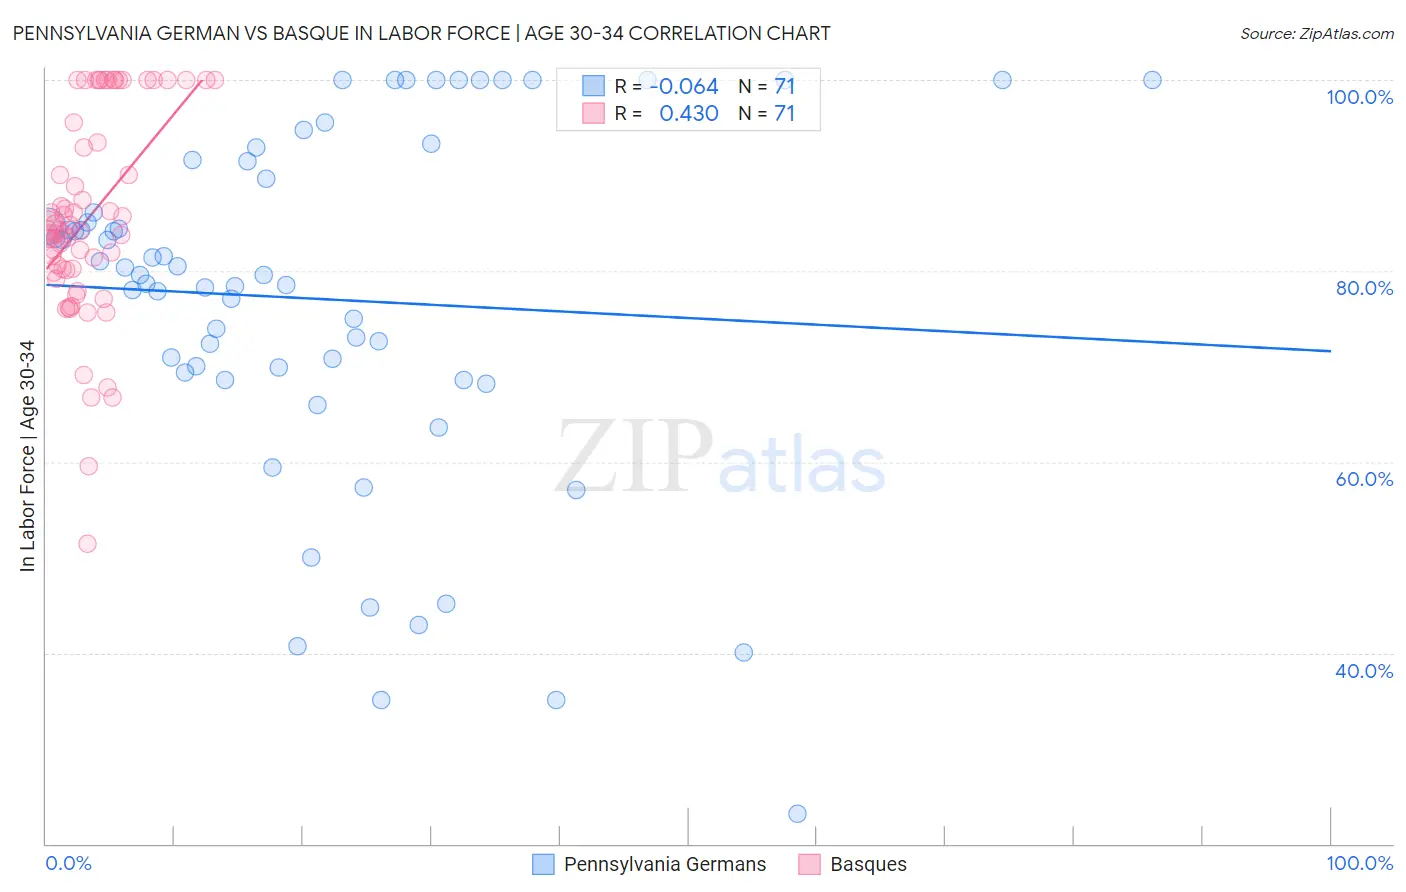
Pennsylvania German vs Basque In Labor Force | Age 30-34 Correlation Chart
The statistical analysis conducted on geographies consisting of 233,986,742 people shows a slight negative correlation between the proportion of Pennsylvania Germans and labor force participation rate among population between the ages 30 and 34 in the United States with a correlation coefficient (R) of -0.064 and weighted average of 82.6%. Similarly, the statistical analysis conducted on geographies consisting of 165,739,384 people shows a moderate positive correlation between the proportion of Basques and labor force participation rate among population between the ages 30 and 34 in the United States with a correlation coefficient (R) of 0.430 and weighted average of 84.0%, a difference of 1.7%.
In Labor Force | Age 30-34 Correlation Summary
| Measurement | Pennsylvania German | Basque |
| Minimum | 23.2% | 51.4% |
| Maximum | 100.0% | 100.0% |
| Range | 76.8% | 48.6% |
| Mean | 77.1% | 85.6% |
| Median | 79.6% | 84.2% |
| Interquartile 25% (IQ1) | 69.4% | 80.1% |
| Interquartile 75% (IQ3) | 91.4% | 95.5% |
| Interquartile Range (IQR) | 22.0% | 15.4% |
| Standard Deviation (Sample) | 18.4% | 10.7% |
| Standard Deviation (Population) | 18.3% | 10.6% |
Similar Demographics by In Labor Force | Age 30-34
Demographics Similar to Pennsylvania Germans by In Labor Force | Age 30-34
In terms of in labor force | age 30-34, the demographic groups most similar to Pennsylvania Germans are Chippewa (82.6%, a difference of 0.020%), Comanche (82.6%, a difference of 0.030%), Aleut (82.6%, a difference of 0.030%), American (82.7%, a difference of 0.12%), and Nepalese (82.7%, a difference of 0.14%).
| Demographics | Rating | Rank | In Labor Force | Age 30-34 |
| Central American Indians | 0.0 /100 | #288 | Tragic 83.0% |
| Hawaiians | 0.0 /100 | #289 | Tragic 83.0% |
| Blackfeet | 0.0 /100 | #290 | Tragic 82.8% |
| Potawatomi | 0.0 /100 | #291 | Tragic 82.8% |
| Blacks/African Americans | 0.0 /100 | #292 | Tragic 82.8% |
| Nepalese | 0.0 /100 | #293 | Tragic 82.7% |
| Americans | 0.0 /100 | #294 | Tragic 82.7% |
| Pennsylvania Germans | 0.0 /100 | #295 | Tragic 82.6% |
| Chippewa | 0.0 /100 | #296 | Tragic 82.6% |
| Comanche | 0.0 /100 | #297 | Tragic 82.6% |
| Aleuts | 0.0 /100 | #298 | Tragic 82.6% |
| Immigrants | Central America | 0.0 /100 | #299 | Tragic 82.5% |
| Hmong | 0.0 /100 | #300 | Tragic 82.4% |
| Hispanics or Latinos | 0.0 /100 | #301 | Tragic 82.4% |
| Ottawa | 0.0 /100 | #302 | Tragic 82.4% |
Demographics Similar to Basques by In Labor Force | Age 30-34
In terms of in labor force | age 30-34, the demographic groups most similar to Basques are Immigrants from Venezuela (84.0%, a difference of 0.0%), Central American (84.0%, a difference of 0.0%), British West Indian (84.0%, a difference of 0.020%), Immigrants from Caribbean (84.0%, a difference of 0.030%), and Portuguese (84.0%, a difference of 0.030%).
| Demographics | Rating | Rank | In Labor Force | Age 30-34 |
| Celtics | 1.4 /100 | #237 | Tragic 84.1% |
| Immigrants | Barbados | 1.4 /100 | #238 | Tragic 84.0% |
| English | 1.4 /100 | #239 | Tragic 84.0% |
| Venezuelans | 1.3 /100 | #240 | Tragic 84.0% |
| Immigrants | Portugal | 1.2 /100 | #241 | Tragic 84.0% |
| Immigrants | Oceania | 1.1 /100 | #242 | Tragic 84.0% |
| Immigrants | Caribbean | 1.1 /100 | #243 | Tragic 84.0% |
| Basques | 0.9 /100 | #244 | Tragic 84.0% |
| Immigrants | Venezuela | 0.9 /100 | #245 | Tragic 84.0% |
| Central Americans | 0.9 /100 | #246 | Tragic 84.0% |
| British West Indians | 0.8 /100 | #247 | Tragic 84.0% |
| Portuguese | 0.8 /100 | #248 | Tragic 84.0% |
| Immigrants | Dominica | 0.7 /100 | #249 | Tragic 84.0% |
| Immigrants | Iraq | 0.7 /100 | #250 | Tragic 83.9% |
| Nicaraguans | 0.6 /100 | #251 | Tragic 83.9% |