Guatemalan vs Basque In Labor Force | Age 30-34
COMPARE
Guatemalan
Basque
In Labor Force | Age 30-34
In Labor Force | Age 30-34 Comparison
Guatemalans
Basques
83.7%
IN LABOR FORCE | AGE 30-34
0.2/ 100
METRIC RATING
264th/ 347
METRIC RANK
84.0%
IN LABOR FORCE | AGE 30-34
0.9/ 100
METRIC RATING
244th/ 347
METRIC RANK
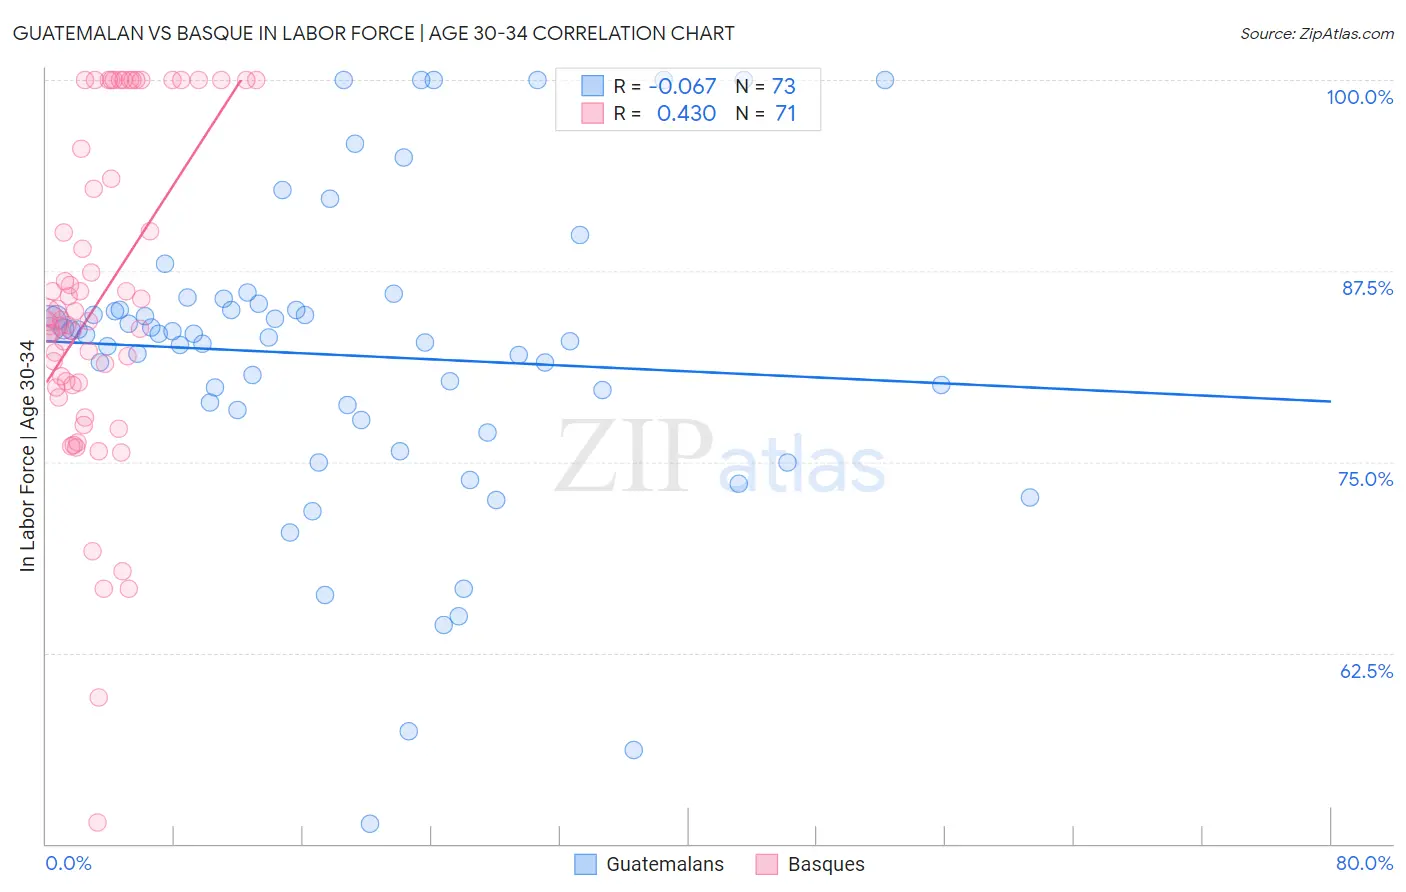
Guatemalan vs Basque In Labor Force | Age 30-34 Correlation Chart
The statistical analysis conducted on geographies consisting of 409,343,950 people shows a slight negative correlation between the proportion of Guatemalans and labor force participation rate among population between the ages 30 and 34 in the United States with a correlation coefficient (R) of -0.067 and weighted average of 83.7%. Similarly, the statistical analysis conducted on geographies consisting of 165,739,384 people shows a moderate positive correlation between the proportion of Basques and labor force participation rate among population between the ages 30 and 34 in the United States with a correlation coefficient (R) of 0.430 and weighted average of 84.0%, a difference of 0.30%.
In Labor Force | Age 30-34 Correlation Summary
| Measurement | Guatemalan | Basque |
| Minimum | 51.3% | 51.4% |
| Maximum | 100.0% | 100.0% |
| Range | 48.7% | 48.6% |
| Mean | 82.0% | 85.6% |
| Median | 83.3% | 84.2% |
| Interquartile 25% (IQ1) | 78.0% | 80.1% |
| Interquartile 75% (IQ3) | 85.1% | 95.5% |
| Interquartile Range (IQR) | 7.1% | 15.4% |
| Standard Deviation (Sample) | 10.0% | 10.7% |
| Standard Deviation (Population) | 9.9% | 10.6% |
Demographics Similar to Guatemalans and Basques by In Labor Force | Age 30-34
In terms of in labor force | age 30-34, the demographic groups most similar to Guatemalans are Dominican (83.8%, a difference of 0.050%), Immigrants from Guyana (83.8%, a difference of 0.050%), Guyanese (83.8%, a difference of 0.070%), Immigrants from Dominican Republic (83.8%, a difference of 0.080%), and Scotch-Irish (83.8%, a difference of 0.090%). Similarly, the demographic groups most similar to Basques are Immigrants from Venezuela (84.0%, a difference of 0.0%), Central American (84.0%, a difference of 0.0%), British West Indian (84.0%, a difference of 0.020%), Portuguese (84.0%, a difference of 0.030%), and Immigrants from Dominica (84.0%, a difference of 0.040%).
| Demographics | Rating | Rank | In Labor Force | Age 30-34 |
| Basques | 0.9 /100 | #244 | Tragic 84.0% |
| Immigrants | Venezuela | 0.9 /100 | #245 | Tragic 84.0% |
| Central Americans | 0.9 /100 | #246 | Tragic 84.0% |
| British West Indians | 0.8 /100 | #247 | Tragic 84.0% |
| Portuguese | 0.8 /100 | #248 | Tragic 84.0% |
| Immigrants | Dominica | 0.7 /100 | #249 | Tragic 84.0% |
| Immigrants | Iraq | 0.7 /100 | #250 | Tragic 83.9% |
| Nicaraguans | 0.6 /100 | #251 | Tragic 83.9% |
| Bahamians | 0.6 /100 | #252 | Tragic 83.9% |
| Immigrants | Nicaragua | 0.6 /100 | #253 | Tragic 83.9% |
| Immigrants | St. Vincent and the Grenadines | 0.5 /100 | #254 | Tragic 83.9% |
| Whites/Caucasians | 0.5 /100 | #255 | Tragic 83.9% |
| Immigrants | Lebanon | 0.4 /100 | #256 | Tragic 83.9% |
| Iraqis | 0.3 /100 | #257 | Tragic 83.8% |
| Hondurans | 0.3 /100 | #258 | Tragic 83.8% |
| Scotch-Irish | 0.3 /100 | #259 | Tragic 83.8% |
| Immigrants | Dominican Republic | 0.3 /100 | #260 | Tragic 83.8% |
| Guyanese | 0.3 /100 | #261 | Tragic 83.8% |
| Dominicans | 0.2 /100 | #262 | Tragic 83.8% |
| Immigrants | Guyana | 0.2 /100 | #263 | Tragic 83.8% |
| Guatemalans | 0.2 /100 | #264 | Tragic 83.7% |