Potawatomi vs Comanche In Labor Force | Age 25-29
COMPARE
Potawatomi
Comanche
In Labor Force | Age 25-29
In Labor Force | Age 25-29 Comparison
Potawatomi
Comanche
82.9%
IN LABOR FORCE | AGE 25-29
0.0/ 100
METRIC RATING
297th/ 347
METRIC RANK
81.9%
IN LABOR FORCE | AGE 25-29
0.0/ 100
METRIC RATING
318th/ 347
METRIC RANK
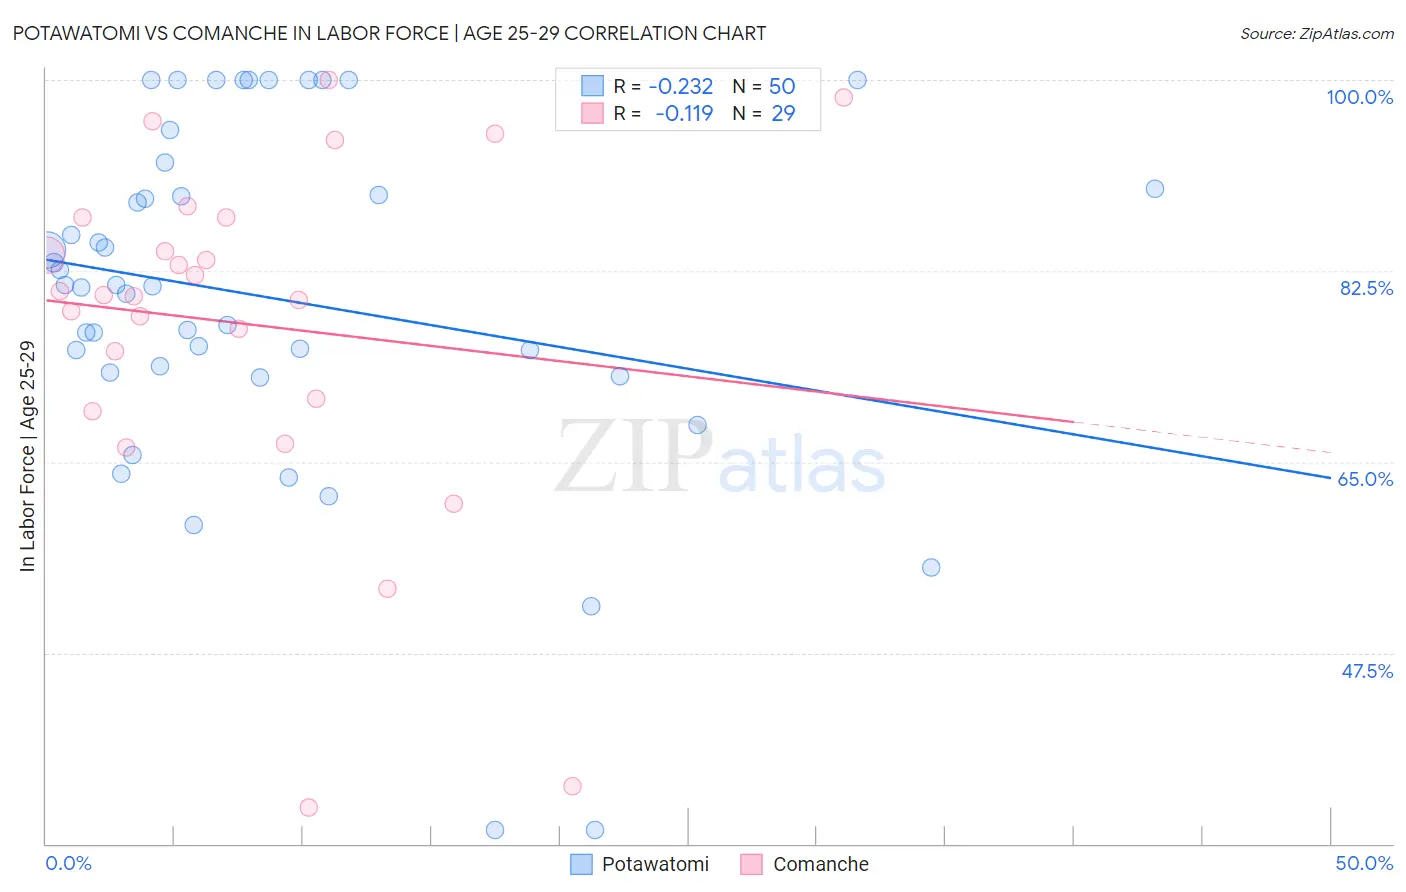
Potawatomi vs Comanche In Labor Force | Age 25-29 Correlation Chart
The statistical analysis conducted on geographies consisting of 117,757,873 people shows a weak negative correlation between the proportion of Potawatomi and labor force participation rate among population between the ages 25 and 29 in the United States with a correlation coefficient (R) of -0.232 and weighted average of 82.9%. Similarly, the statistical analysis conducted on geographies consisting of 109,769,144 people shows a poor negative correlation between the proportion of Comanche and labor force participation rate among population between the ages 25 and 29 in the United States with a correlation coefficient (R) of -0.119 and weighted average of 81.9%, a difference of 1.3%.
In Labor Force | Age 25-29 Correlation Summary
| Measurement | Potawatomi | Comanche |
| Minimum | 31.3% | 33.3% |
| Maximum | 100.0% | 100.0% |
| Range | 68.7% | 66.7% |
| Mean | 80.0% | 77.6% |
| Median | 81.1% | 80.3% |
| Interquartile 25% (IQ1) | 73.2% | 70.2% |
| Interquartile 75% (IQ3) | 90.0% | 87.4% |
| Interquartile Range (IQR) | 16.8% | 17.2% |
| Standard Deviation (Sample) | 16.3% | 16.2% |
| Standard Deviation (Population) | 16.1% | 15.9% |
Similar Demographics by In Labor Force | Age 25-29
Demographics Similar to Potawatomi by In Labor Force | Age 25-29
In terms of in labor force | age 25-29, the demographic groups most similar to Potawatomi are Chippewa (82.9%, a difference of 0.0%), Immigrants from Nicaragua (82.9%, a difference of 0.0%), Immigrants from Latin America (82.9%, a difference of 0.010%), Nepalese (82.9%, a difference of 0.010%), and Native Hawaiian (82.9%, a difference of 0.010%).
| Demographics | Rating | Rank | In Labor Force | Age 25-29 |
| Immigrants | Bangladesh | 0.0 /100 | #290 | Tragic 83.0% |
| Hawaiians | 0.0 /100 | #291 | Tragic 83.0% |
| Immigrants | Guyana | 0.0 /100 | #292 | Tragic 83.0% |
| Immigrants | Latin America | 0.0 /100 | #293 | Tragic 82.9% |
| Nepalese | 0.0 /100 | #294 | Tragic 82.9% |
| Chippewa | 0.0 /100 | #295 | Tragic 82.9% |
| Immigrants | Nicaragua | 0.0 /100 | #296 | Tragic 82.9% |
| Potawatomi | 0.0 /100 | #297 | Tragic 82.9% |
| Native Hawaiians | 0.0 /100 | #298 | Tragic 82.9% |
| Fijians | 0.0 /100 | #299 | Tragic 82.9% |
| Spanish American Indians | 0.0 /100 | #300 | Tragic 82.9% |
| Vietnamese | 0.0 /100 | #301 | Tragic 82.8% |
| Immigrants | Belize | 0.0 /100 | #302 | Tragic 82.8% |
| Immigrants | Grenada | 0.0 /100 | #303 | Tragic 82.8% |
| Immigrants | St. Vincent and the Grenadines | 0.0 /100 | #304 | Tragic 82.7% |
Demographics Similar to Comanche by In Labor Force | Age 25-29
In terms of in labor force | age 25-29, the demographic groups most similar to Comanche are Chickasaw (81.9%, a difference of 0.010%), Mexican (81.9%, a difference of 0.090%), Immigrants from Mexico (82.0%, a difference of 0.17%), Seminole (81.7%, a difference of 0.22%), and Colville (81.6%, a difference of 0.27%).
| Demographics | Rating | Rank | In Labor Force | Age 25-29 |
| Alaskan Athabascans | 0.0 /100 | #311 | Tragic 82.3% |
| Hispanics or Latinos | 0.0 /100 | #312 | Tragic 82.2% |
| Yaqui | 0.0 /100 | #313 | Tragic 82.2% |
| Cherokee | 0.0 /100 | #314 | Tragic 82.1% |
| Immigrants | Mexico | 0.0 /100 | #315 | Tragic 82.0% |
| Mexicans | 0.0 /100 | #316 | Tragic 81.9% |
| Chickasaw | 0.0 /100 | #317 | Tragic 81.9% |
| Comanche | 0.0 /100 | #318 | Tragic 81.9% |
| Seminole | 0.0 /100 | #319 | Tragic 81.7% |
| Colville | 0.0 /100 | #320 | Tragic 81.6% |
| Shoshone | 0.0 /100 | #321 | Tragic 81.6% |
| Kiowa | 0.0 /100 | #322 | Tragic 81.6% |
| Alaska Natives | 0.0 /100 | #323 | Tragic 81.6% |
| Houma | 0.0 /100 | #324 | Tragic 81.2% |
| Dutch West Indians | 0.0 /100 | #325 | Tragic 81.1% |