Immigrants from Western Europe vs Comanche In Labor Force | Age 25-29
COMPARE
Immigrants from Western Europe
Comanche
In Labor Force | Age 25-29
In Labor Force | Age 25-29 Comparison
Immigrants from Western Europe
Comanche
84.7%
IN LABOR FORCE | AGE 25-29
50.4/ 100
METRIC RATING
172nd/ 347
METRIC RANK
81.9%
IN LABOR FORCE | AGE 25-29
0.0/ 100
METRIC RATING
318th/ 347
METRIC RANK
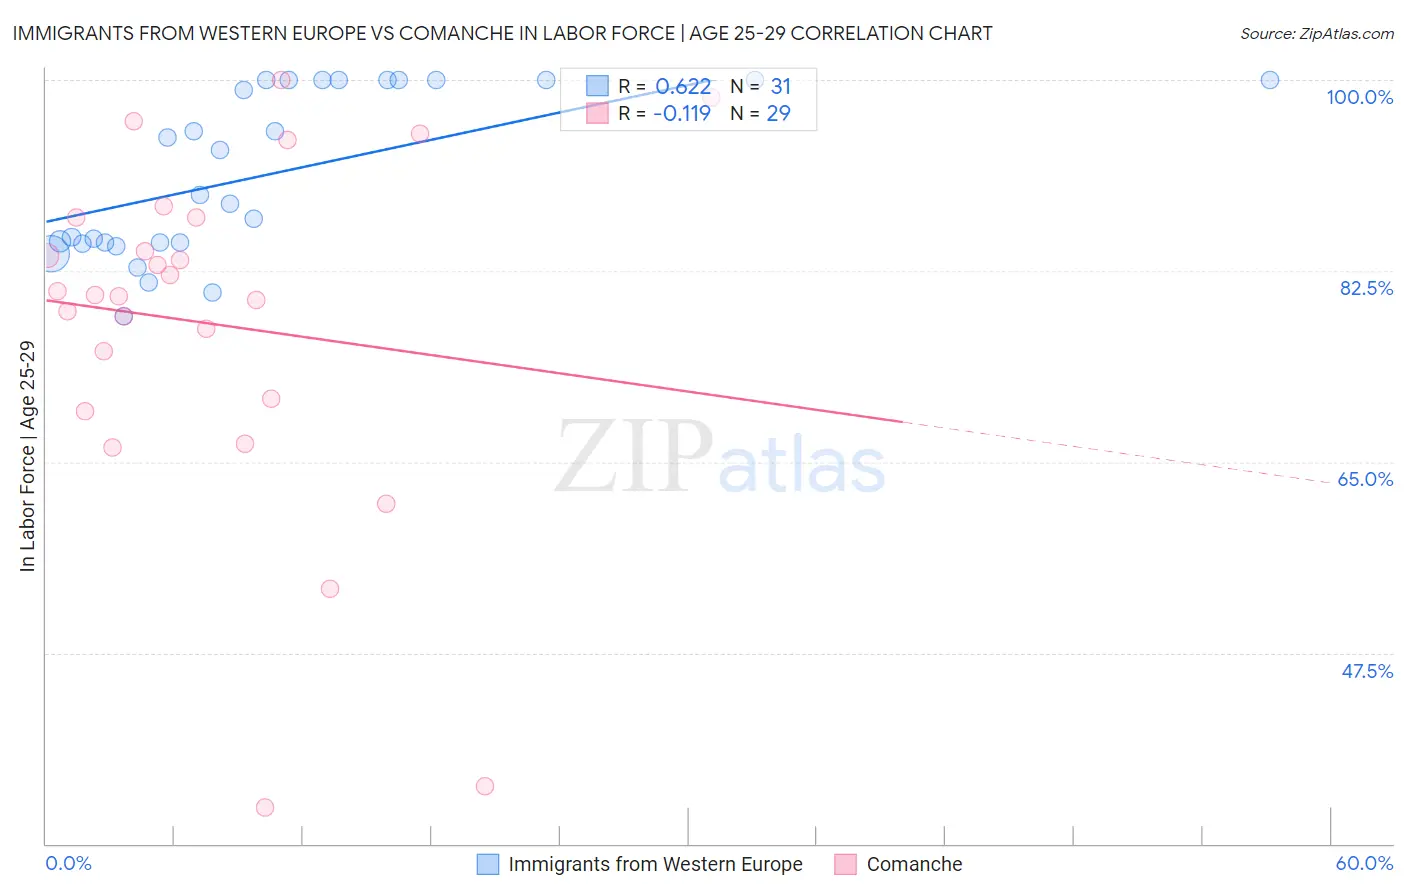
Immigrants from Western Europe vs Comanche In Labor Force | Age 25-29 Correlation Chart
The statistical analysis conducted on geographies consisting of 493,653,043 people shows a significant positive correlation between the proportion of Immigrants from Western Europe and labor force participation rate among population between the ages 25 and 29 in the United States with a correlation coefficient (R) of 0.622 and weighted average of 84.7%. Similarly, the statistical analysis conducted on geographies consisting of 109,769,144 people shows a poor negative correlation between the proportion of Comanche and labor force participation rate among population between the ages 25 and 29 in the United States with a correlation coefficient (R) of -0.119 and weighted average of 81.9%, a difference of 3.4%.
In Labor Force | Age 25-29 Correlation Summary
| Measurement | Immigrants from Western Europe | Comanche |
| Minimum | 78.3% | 33.3% |
| Maximum | 100.0% | 100.0% |
| Range | 21.7% | 66.7% |
| Mean | 91.4% | 77.6% |
| Median | 89.5% | 80.3% |
| Interquartile 25% (IQ1) | 85.1% | 70.2% |
| Interquartile 75% (IQ3) | 100.0% | 87.4% |
| Interquartile Range (IQR) | 14.9% | 17.2% |
| Standard Deviation (Sample) | 7.5% | 16.2% |
| Standard Deviation (Population) | 7.4% | 15.9% |
Similar Demographics by In Labor Force | Age 25-29
Demographics Similar to Immigrants from Western Europe by In Labor Force | Age 25-29
In terms of in labor force | age 25-29, the demographic groups most similar to Immigrants from Western Europe are Immigrants from Vietnam (84.7%, a difference of 0.0%), Assyrian/Chaldean/Syriac (84.7%, a difference of 0.0%), Palestinian (84.7%, a difference of 0.0%), Celtic (84.7%, a difference of 0.010%), and Tongan (84.7%, a difference of 0.010%).
| Demographics | Rating | Rank | In Labor Force | Age 25-29 |
| Immigrants | Burma/Myanmar | 57.4 /100 | #165 | Average 84.7% |
| Immigrants | Spain | 56.9 /100 | #166 | Average 84.7% |
| Indonesians | 56.5 /100 | #167 | Average 84.7% |
| South Americans | 54.9 /100 | #168 | Average 84.7% |
| Celtics | 52.5 /100 | #169 | Average 84.7% |
| Tongans | 52.4 /100 | #170 | Average 84.7% |
| Immigrants | Vietnam | 50.5 /100 | #171 | Average 84.7% |
| Immigrants | Western Europe | 50.4 /100 | #172 | Average 84.7% |
| Assyrians/Chaldeans/Syriacs | 50.2 /100 | #173 | Average 84.7% |
| Palestinians | 50.0 /100 | #174 | Average 84.7% |
| Hungarians | 47.8 /100 | #175 | Average 84.6% |
| Malaysians | 46.8 /100 | #176 | Average 84.6% |
| Immigrants | China | 45.7 /100 | #177 | Average 84.6% |
| Immigrants | Thailand | 45.2 /100 | #178 | Average 84.6% |
| Immigrants | Argentina | 44.0 /100 | #179 | Average 84.6% |
Demographics Similar to Comanche by In Labor Force | Age 25-29
In terms of in labor force | age 25-29, the demographic groups most similar to Comanche are Chickasaw (81.9%, a difference of 0.010%), Mexican (81.9%, a difference of 0.090%), Immigrants from Mexico (82.0%, a difference of 0.17%), Seminole (81.7%, a difference of 0.22%), and Colville (81.6%, a difference of 0.27%).
| Demographics | Rating | Rank | In Labor Force | Age 25-29 |
| Alaskan Athabascans | 0.0 /100 | #311 | Tragic 82.3% |
| Hispanics or Latinos | 0.0 /100 | #312 | Tragic 82.2% |
| Yaqui | 0.0 /100 | #313 | Tragic 82.2% |
| Cherokee | 0.0 /100 | #314 | Tragic 82.1% |
| Immigrants | Mexico | 0.0 /100 | #315 | Tragic 82.0% |
| Mexicans | 0.0 /100 | #316 | Tragic 81.9% |
| Chickasaw | 0.0 /100 | #317 | Tragic 81.9% |
| Comanche | 0.0 /100 | #318 | Tragic 81.9% |
| Seminole | 0.0 /100 | #319 | Tragic 81.7% |
| Colville | 0.0 /100 | #320 | Tragic 81.6% |
| Shoshone | 0.0 /100 | #321 | Tragic 81.6% |
| Kiowa | 0.0 /100 | #322 | Tragic 81.6% |
| Alaska Natives | 0.0 /100 | #323 | Tragic 81.6% |
| Houma | 0.0 /100 | #324 | Tragic 81.2% |
| Dutch West Indians | 0.0 /100 | #325 | Tragic 81.1% |