Mongolian vs Navajo In Labor Force | Age 25-29
COMPARE
Mongolian
Navajo
In Labor Force | Age 25-29
In Labor Force | Age 25-29 Comparison
Mongolians
Navajo
85.1%
IN LABOR FORCE | AGE 25-29
94.1/ 100
METRIC RATING
98th/ 347
METRIC RANK
74.6%
IN LABOR FORCE | AGE 25-29
0.0/ 100
METRIC RATING
345th/ 347
METRIC RANK
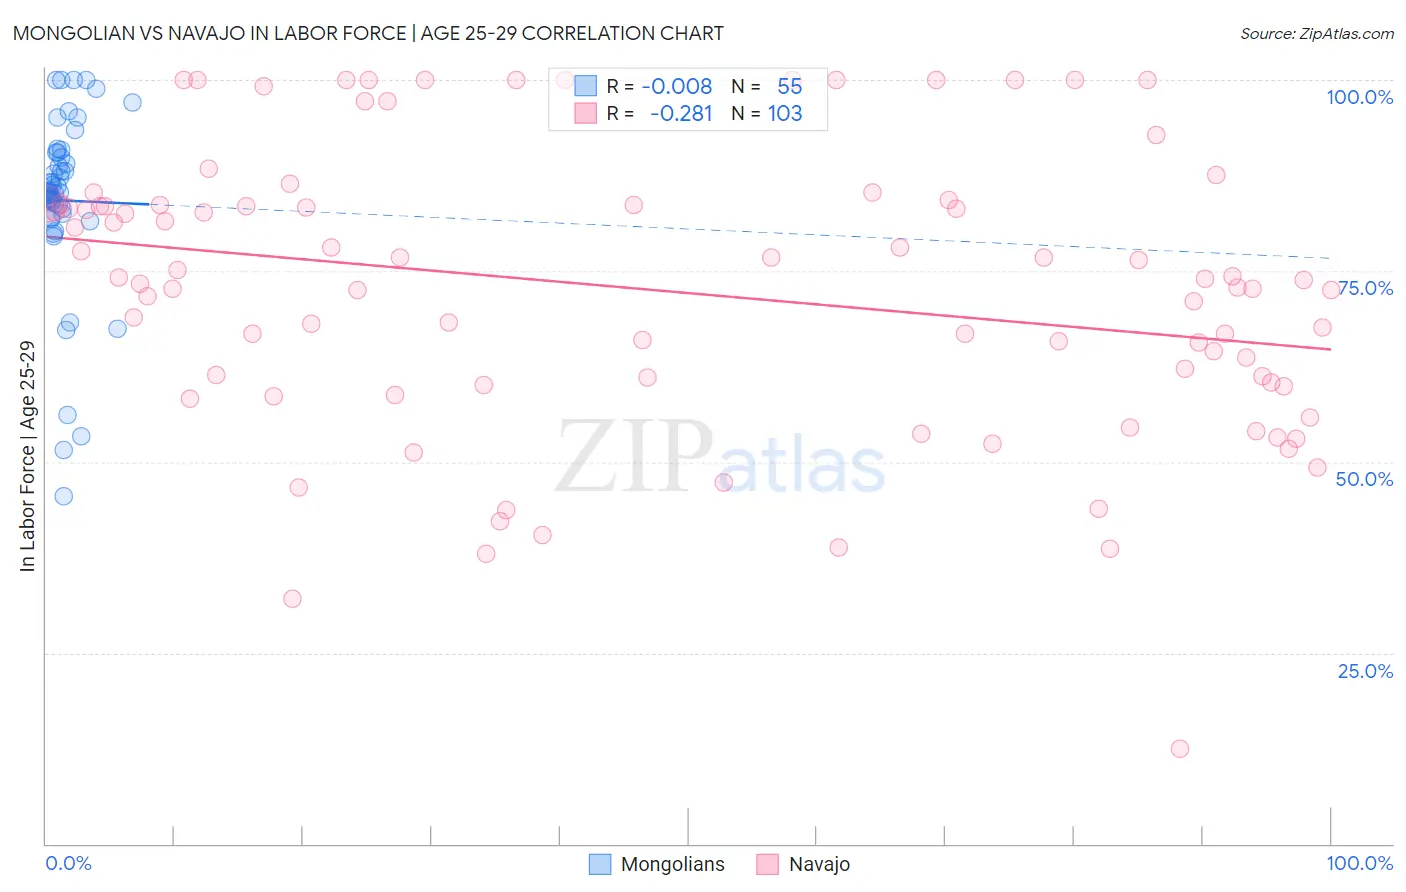
Mongolian vs Navajo In Labor Force | Age 25-29 Correlation Chart
The statistical analysis conducted on geographies consisting of 140,349,475 people shows no correlation between the proportion of Mongolians and labor force participation rate among population between the ages 25 and 29 in the United States with a correlation coefficient (R) of -0.008 and weighted average of 85.1%. Similarly, the statistical analysis conducted on geographies consisting of 224,779,280 people shows a weak negative correlation between the proportion of Navajo and labor force participation rate among population between the ages 25 and 29 in the United States with a correlation coefficient (R) of -0.281 and weighted average of 74.6%, a difference of 14.0%.
In Labor Force | Age 25-29 Correlation Summary
| Measurement | Mongolian | Navajo |
| Minimum | 45.5% | 12.5% |
| Maximum | 100.0% | 100.0% |
| Range | 54.5% | 87.5% |
| Mean | 84.2% | 72.4% |
| Median | 85.2% | 73.9% |
| Interquartile 25% (IQ1) | 82.5% | 60.0% |
| Interquartile 75% (IQ3) | 90.5% | 83.7% |
| Interquartile Range (IQR) | 8.0% | 23.7% |
| Standard Deviation (Sample) | 11.7% | 18.5% |
| Standard Deviation (Population) | 11.6% | 18.4% |
Similar Demographics by In Labor Force | Age 25-29
Demographics Similar to Mongolians by In Labor Force | Age 25-29
In terms of in labor force | age 25-29, the demographic groups most similar to Mongolians are Bangladeshi (85.1%, a difference of 0.0%), Immigrants from Sudan (85.1%, a difference of 0.010%), Immigrants from Switzerland (85.1%, a difference of 0.010%), Egyptian (85.1%, a difference of 0.010%), and Slavic (85.1%, a difference of 0.010%).
| Demographics | Rating | Rank | In Labor Force | Age 25-29 |
| Immigrants | Moldova | 95.8 /100 | #91 | Exceptional 85.1% |
| Immigrants | Costa Rica | 95.5 /100 | #92 | Exceptional 85.1% |
| Austrians | 95.3 /100 | #93 | Exceptional 85.1% |
| Immigrants | Korea | 94.8 /100 | #94 | Exceptional 85.1% |
| Immigrants | Netherlands | 94.6 /100 | #95 | Exceptional 85.1% |
| Immigrants | Romania | 94.6 /100 | #96 | Exceptional 85.1% |
| Immigrants | Sudan | 94.3 /100 | #97 | Exceptional 85.1% |
| Mongolians | 94.1 /100 | #98 | Exceptional 85.1% |
| Bangladeshis | 94.0 /100 | #99 | Exceptional 85.1% |
| Immigrants | Switzerland | 93.9 /100 | #100 | Exceptional 85.1% |
| Egyptians | 93.8 /100 | #101 | Exceptional 85.1% |
| Slavs | 93.7 /100 | #102 | Exceptional 85.1% |
| Immigrants | Japan | 93.5 /100 | #103 | Exceptional 85.1% |
| Immigrants | Zaire | 93.3 /100 | #104 | Exceptional 85.1% |
| Immigrants | Hong Kong | 92.8 /100 | #105 | Exceptional 85.0% |
Demographics Similar to Navajo by In Labor Force | Age 25-29
In terms of in labor force | age 25-29, the demographic groups most similar to Navajo are Pima (74.3%, a difference of 0.48%), Yup'ik (73.1%, a difference of 2.2%), Hopi (76.5%, a difference of 2.5%), Arapaho (76.6%, a difference of 2.6%), and Pueblo (77.5%, a difference of 3.8%).
| Demographics | Rating | Rank | In Labor Force | Age 25-29 |
| Sioux | 0.0 /100 | #333 | Tragic 79.7% |
| Yuman | 0.0 /100 | #334 | Tragic 79.3% |
| Natives/Alaskans | 0.0 /100 | #335 | Tragic 79.3% |
| Apache | 0.0 /100 | #336 | Tragic 79.2% |
| Crow | 0.0 /100 | #337 | Tragic 78.6% |
| Lumbee | 0.0 /100 | #338 | Tragic 78.3% |
| Immigrants | Yemen | 0.0 /100 | #339 | Tragic 78.2% |
| Paiute | 0.0 /100 | #340 | Tragic 78.1% |
| Tohono O'odham | 0.0 /100 | #341 | Tragic 77.5% |
| Pueblo | 0.0 /100 | #342 | Tragic 77.5% |
| Arapaho | 0.0 /100 | #343 | Tragic 76.6% |
| Hopi | 0.0 /100 | #344 | Tragic 76.5% |
| Navajo | 0.0 /100 | #345 | Tragic 74.6% |
| Pima | 0.0 /100 | #346 | Tragic 74.3% |
| Yup'ik | 0.0 /100 | #347 | Tragic 73.1% |