Mongolian vs Puerto Rican In Labor Force | Age 25-29
COMPARE
Mongolian
Puerto Rican
In Labor Force | Age 25-29
In Labor Force | Age 25-29 Comparison
Mongolians
Puerto Ricans
85.1%
IN LABOR FORCE | AGE 25-29
94.1/ 100
METRIC RATING
98th/ 347
METRIC RANK
80.4%
IN LABOR FORCE | AGE 25-29
0.0/ 100
METRIC RATING
330th/ 347
METRIC RANK
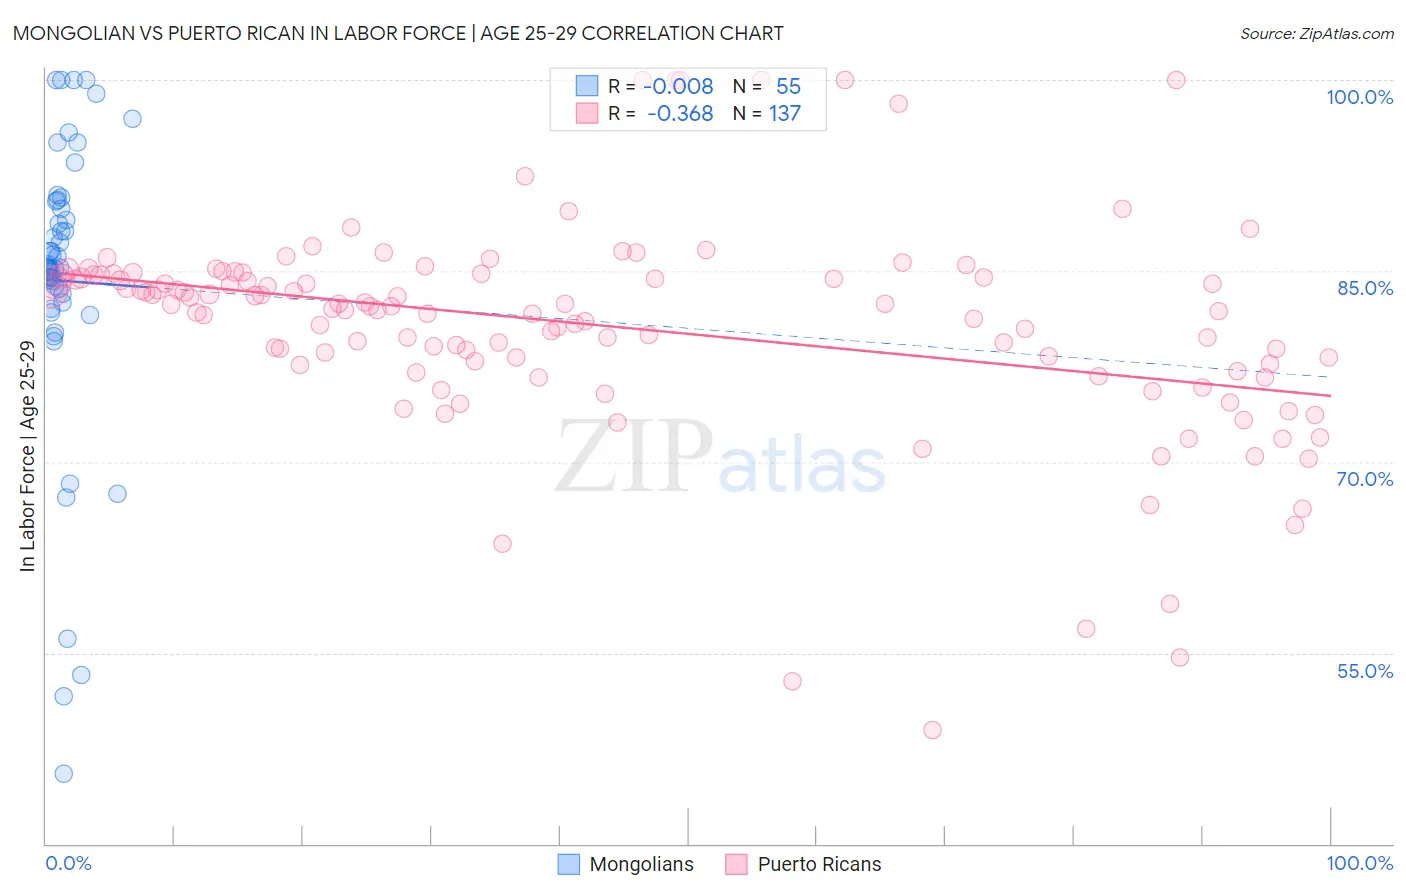
Mongolian vs Puerto Rican In Labor Force | Age 25-29 Correlation Chart
The statistical analysis conducted on geographies consisting of 140,349,475 people shows no correlation between the proportion of Mongolians and labor force participation rate among population between the ages 25 and 29 in the United States with a correlation coefficient (R) of -0.008 and weighted average of 85.1%. Similarly, the statistical analysis conducted on geographies consisting of 527,795,348 people shows a mild negative correlation between the proportion of Puerto Ricans and labor force participation rate among population between the ages 25 and 29 in the United States with a correlation coefficient (R) of -0.368 and weighted average of 80.4%, a difference of 5.8%.
In Labor Force | Age 25-29 Correlation Summary
| Measurement | Mongolian | Puerto Rican |
| Minimum | 45.5% | 48.9% |
| Maximum | 100.0% | 100.0% |
| Range | 54.5% | 51.1% |
| Mean | 84.2% | 80.7% |
| Median | 85.2% | 82.2% |
| Interquartile 25% (IQ1) | 82.5% | 77.7% |
| Interquartile 75% (IQ3) | 90.5% | 84.6% |
| Interquartile Range (IQR) | 8.0% | 6.9% |
| Standard Deviation (Sample) | 11.7% | 8.4% |
| Standard Deviation (Population) | 11.6% | 8.3% |
Similar Demographics by In Labor Force | Age 25-29
Demographics Similar to Mongolians by In Labor Force | Age 25-29
In terms of in labor force | age 25-29, the demographic groups most similar to Mongolians are Bangladeshi (85.1%, a difference of 0.0%), Immigrants from Sudan (85.1%, a difference of 0.010%), Immigrants from Switzerland (85.1%, a difference of 0.010%), Egyptian (85.1%, a difference of 0.010%), and Slavic (85.1%, a difference of 0.010%).
| Demographics | Rating | Rank | In Labor Force | Age 25-29 |
| Immigrants | Moldova | 95.8 /100 | #91 | Exceptional 85.1% |
| Immigrants | Costa Rica | 95.5 /100 | #92 | Exceptional 85.1% |
| Austrians | 95.3 /100 | #93 | Exceptional 85.1% |
| Immigrants | Korea | 94.8 /100 | #94 | Exceptional 85.1% |
| Immigrants | Netherlands | 94.6 /100 | #95 | Exceptional 85.1% |
| Immigrants | Romania | 94.6 /100 | #96 | Exceptional 85.1% |
| Immigrants | Sudan | 94.3 /100 | #97 | Exceptional 85.1% |
| Mongolians | 94.1 /100 | #98 | Exceptional 85.1% |
| Bangladeshis | 94.0 /100 | #99 | Exceptional 85.1% |
| Immigrants | Switzerland | 93.9 /100 | #100 | Exceptional 85.1% |
| Egyptians | 93.8 /100 | #101 | Exceptional 85.1% |
| Slavs | 93.7 /100 | #102 | Exceptional 85.1% |
| Immigrants | Japan | 93.5 /100 | #103 | Exceptional 85.1% |
| Immigrants | Zaire | 93.3 /100 | #104 | Exceptional 85.1% |
| Immigrants | Hong Kong | 92.8 /100 | #105 | Exceptional 85.0% |
Demographics Similar to Puerto Ricans by In Labor Force | Age 25-29
In terms of in labor force | age 25-29, the demographic groups most similar to Puerto Ricans are Cheyenne (80.3%, a difference of 0.14%), Yakama (80.6%, a difference of 0.23%), Creek (80.7%, a difference of 0.34%), Ute (80.8%, a difference of 0.48%), and Choctaw (81.0%, a difference of 0.69%).
| Demographics | Rating | Rank | In Labor Force | Age 25-29 |
| Alaska Natives | 0.0 /100 | #323 | Tragic 81.6% |
| Houma | 0.0 /100 | #324 | Tragic 81.2% |
| Dutch West Indians | 0.0 /100 | #325 | Tragic 81.1% |
| Choctaw | 0.0 /100 | #326 | Tragic 81.0% |
| Ute | 0.0 /100 | #327 | Tragic 80.8% |
| Creek | 0.0 /100 | #328 | Tragic 80.7% |
| Yakama | 0.0 /100 | #329 | Tragic 80.6% |
| Puerto Ricans | 0.0 /100 | #330 | Tragic 80.4% |
| Cheyenne | 0.0 /100 | #331 | Tragic 80.3% |
| Inupiat | 0.0 /100 | #332 | Tragic 79.8% |
| Sioux | 0.0 /100 | #333 | Tragic 79.7% |
| Yuman | 0.0 /100 | #334 | Tragic 79.3% |
| Natives/Alaskans | 0.0 /100 | #335 | Tragic 79.3% |
| Apache | 0.0 /100 | #336 | Tragic 79.2% |
| Crow | 0.0 /100 | #337 | Tragic 78.6% |