Menominee vs Immigrants from Zimbabwe Seniors Poverty Over the Age of 65
COMPARE
Menominee
Immigrants from Zimbabwe
Seniors Poverty Over the Age of 65
Seniors Poverty Over the Age of 65 Comparison
Menominee
Immigrants from Zimbabwe
9.4%
SENIORS POVERTY OVER THE AGE OF 65
99.8/ 100
METRIC RATING
30th/ 347
METRIC RANK
10.3%
SENIORS POVERTY OVER THE AGE OF 65
93.5/ 100
METRIC RATING
110th/ 347
METRIC RANK
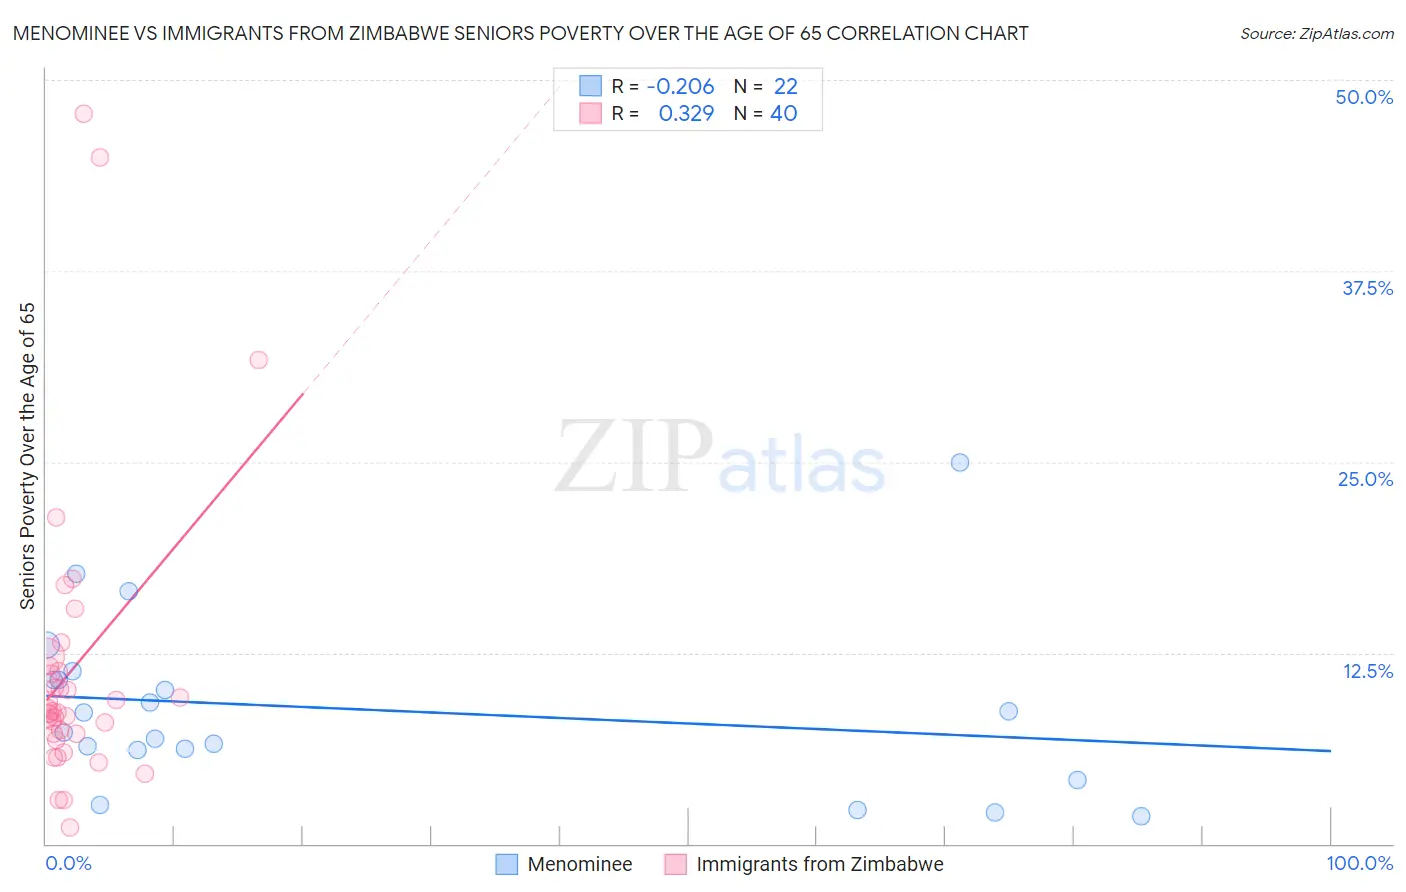
Menominee vs Immigrants from Zimbabwe Seniors Poverty Over the Age of 65 Correlation Chart
The statistical analysis conducted on geographies consisting of 45,758,945 people shows a weak negative correlation between the proportion of Menominee and poverty level among seniors over the age of 65 in the United States with a correlation coefficient (R) of -0.206 and weighted average of 9.4%. Similarly, the statistical analysis conducted on geographies consisting of 117,654,725 people shows a mild positive correlation between the proportion of Immigrants from Zimbabwe and poverty level among seniors over the age of 65 in the United States with a correlation coefficient (R) of 0.329 and weighted average of 10.3%, a difference of 9.9%.
Seniors Poverty Over the Age of 65 Correlation Summary
| Measurement | Menominee | Immigrants from Zimbabwe |
| Minimum | 1.8% | 1.0% |
| Maximum | 25.0% | 47.8% |
| Range | 23.2% | 46.7% |
| Mean | 8.8% | 11.5% |
| Median | 7.9% | 8.6% |
| Interquartile 25% (IQ1) | 6.1% | 7.2% |
| Interquartile 75% (IQ3) | 10.7% | 11.5% |
| Interquartile Range (IQR) | 4.6% | 4.3% |
| Standard Deviation (Sample) | 5.6% | 9.7% |
| Standard Deviation (Population) | 5.5% | 9.6% |
Similar Demographics by Seniors Poverty Over the Age of 65
Demographics Similar to Menominee by Seniors Poverty Over the Age of 65
In terms of seniors poverty over the age of 65, the demographic groups most similar to Menominee are Bhutanese (9.3%, a difference of 0.15%), Finnish (9.4%, a difference of 0.22%), Tongan (9.3%, a difference of 0.48%), Northern European (9.4%, a difference of 0.50%), and Native Hawaiian (9.4%, a difference of 0.52%).
| Demographics | Rating | Rank | Seniors Poverty Over the Age of 65 |
| Welsh | 99.9 /100 | #23 | Exceptional 9.3% |
| Bulgarians | 99.9 /100 | #24 | Exceptional 9.3% |
| Irish | 99.9 /100 | #25 | Exceptional 9.3% |
| Immigrants | Scotland | 99.9 /100 | #26 | Exceptional 9.3% |
| Italians | 99.9 /100 | #27 | Exceptional 9.3% |
| Tongans | 99.9 /100 | #28 | Exceptional 9.3% |
| Bhutanese | 99.9 /100 | #29 | Exceptional 9.3% |
| Menominee | 99.8 /100 | #30 | Exceptional 9.4% |
| Finns | 99.8 /100 | #31 | Exceptional 9.4% |
| Northern Europeans | 99.8 /100 | #32 | Exceptional 9.4% |
| Native Hawaiians | 99.8 /100 | #33 | Exceptional 9.4% |
| British | 99.8 /100 | #34 | Exceptional 9.4% |
| Latvians | 99.8 /100 | #35 | Exceptional 9.5% |
| Czechoslovakians | 99.8 /100 | #36 | Exceptional 9.5% |
| Scotch-Irish | 99.7 /100 | #37 | Exceptional 9.5% |
Demographics Similar to Immigrants from Zimbabwe by Seniors Poverty Over the Age of 65
In terms of seniors poverty over the age of 65, the demographic groups most similar to Immigrants from Zimbabwe are Immigrants from Belgium (10.3%, a difference of 0.030%), Immigrants from Korea (10.3%, a difference of 0.060%), Immigrants from Romania (10.3%, a difference of 0.090%), Syrian (10.3%, a difference of 0.14%), and Immigrants from Croatia (10.3%, a difference of 0.16%).
| Demographics | Rating | Rank | Seniors Poverty Over the Age of 65 |
| Icelanders | 94.4 /100 | #103 | Exceptional 10.3% |
| South Africans | 94.3 /100 | #104 | Exceptional 10.3% |
| Aleuts | 94.1 /100 | #105 | Exceptional 10.3% |
| Kenyans | 94.1 /100 | #106 | Exceptional 10.3% |
| Hawaiians | 93.9 /100 | #107 | Exceptional 10.3% |
| Immigrants | Croatia | 93.9 /100 | #108 | Exceptional 10.3% |
| Syrians | 93.8 /100 | #109 | Exceptional 10.3% |
| Immigrants | Zimbabwe | 93.5 /100 | #110 | Exceptional 10.3% |
| Immigrants | Belgium | 93.4 /100 | #111 | Exceptional 10.3% |
| Immigrants | Korea | 93.3 /100 | #112 | Exceptional 10.3% |
| Immigrants | Romania | 93.3 /100 | #113 | Exceptional 10.3% |
| Immigrants | Denmark | 92.7 /100 | #114 | Exceptional 10.3% |
| Immigrants | Italy | 92.6 /100 | #115 | Exceptional 10.3% |
| Pakistanis | 92.2 /100 | #116 | Exceptional 10.3% |
| Lebanese | 92.0 /100 | #117 | Exceptional 10.3% |