Menominee vs Immigrants from Micronesia In Labor Force | Age 20-24
COMPARE
Menominee
Immigrants from Micronesia
In Labor Force | Age 20-24
In Labor Force | Age 20-24 Comparison
Menominee
Immigrants from Micronesia
68.7%
IN LABOR FORCE | AGE 20-24
0.0/ 100
METRIC RATING
340th/ 347
METRIC RANK
77.8%
IN LABOR FORCE | AGE 20-24
100.0/ 100
METRIC RATING
27th/ 347
METRIC RANK
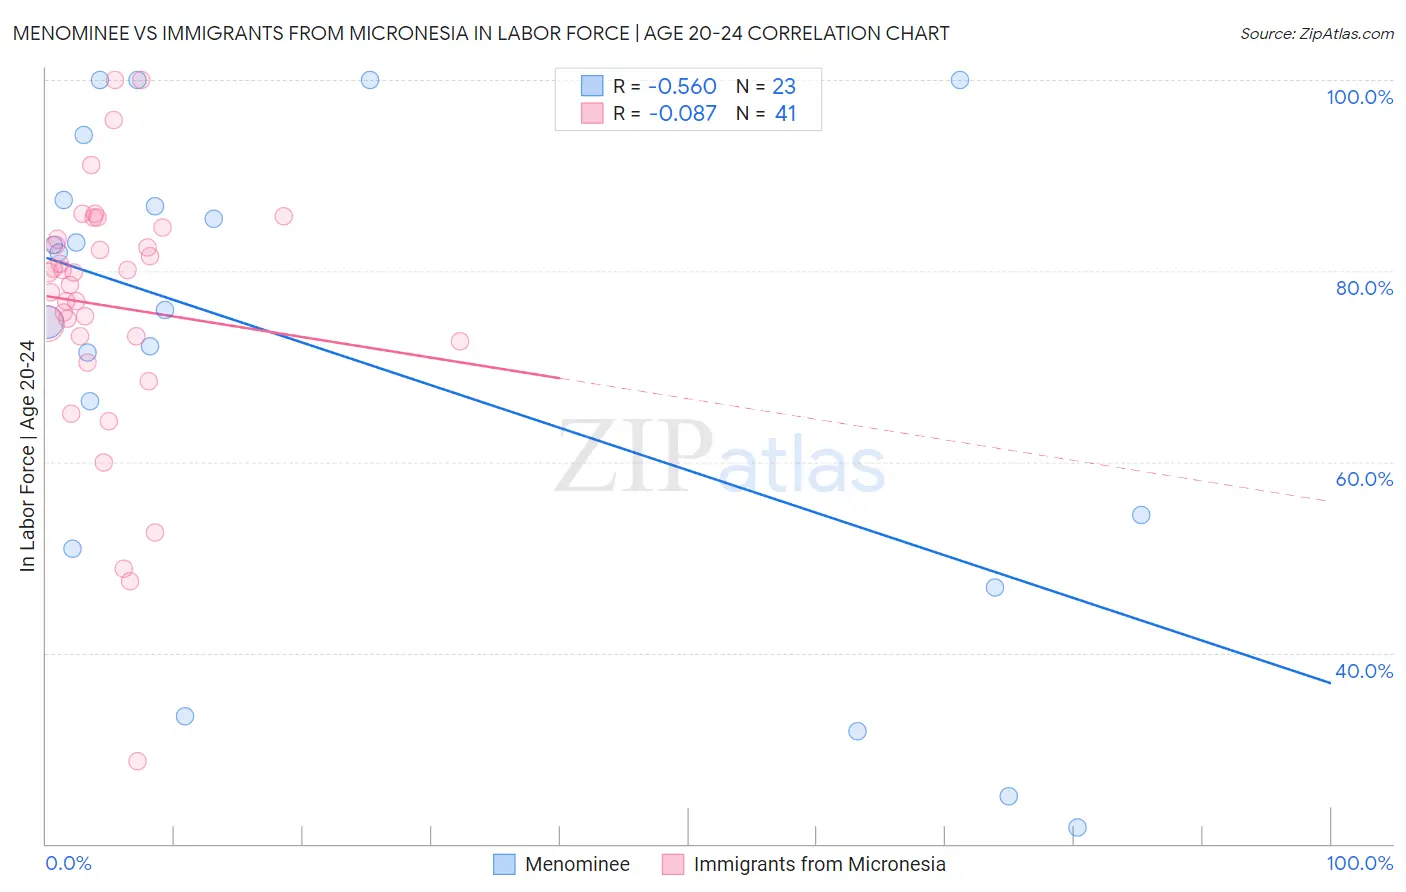
Menominee vs Immigrants from Micronesia In Labor Force | Age 20-24 Correlation Chart
The statistical analysis conducted on geographies consisting of 45,776,485 people shows a substantial negative correlation between the proportion of Menominee and labor force participation rate among population between the ages 20 and 24 in the United States with a correlation coefficient (R) of -0.560 and weighted average of 68.7%. Similarly, the statistical analysis conducted on geographies consisting of 61,601,433 people shows a slight negative correlation between the proportion of Immigrants from Micronesia and labor force participation rate among population between the ages 20 and 24 in the United States with a correlation coefficient (R) of -0.087 and weighted average of 77.8%, a difference of 13.3%.
In Labor Force | Age 20-24 Correlation Summary
| Measurement | Menominee | Immigrants from Micronesia |
| Minimum | 21.7% | 28.6% |
| Maximum | 100.0% | 100.0% |
| Range | 78.3% | 71.4% |
| Mean | 70.7% | 76.3% |
| Median | 75.9% | 79.8% |
| Interquartile 25% (IQ1) | 50.9% | 72.9% |
| Interquartile 75% (IQ3) | 87.4% | 84.0% |
| Interquartile Range (IQR) | 36.5% | 11.0% |
| Standard Deviation (Sample) | 25.1% | 13.8% |
| Standard Deviation (Population) | 24.5% | 13.6% |
Similar Demographics by In Labor Force | Age 20-24
Demographics Similar to Menominee by In Labor Force | Age 20-24
In terms of in labor force | age 20-24, the demographic groups most similar to Menominee are Tohono O'odham (68.6%, a difference of 0.13%), Immigrants from Yemen (68.9%, a difference of 0.31%), Pima (69.0%, a difference of 0.44%), Immigrants from St. Vincent and the Grenadines (68.4%, a difference of 0.44%), and Puerto Rican (68.3%, a difference of 0.56%).
| Demographics | Rating | Rank | In Labor Force | Age 20-24 |
| Yuman | 0.0 /100 | #333 | Tragic 70.3% |
| British West Indians | 0.0 /100 | #334 | Tragic 70.0% |
| Immigrants | Barbados | 0.0 /100 | #335 | Tragic 69.7% |
| Immigrants | Guyana | 0.0 /100 | #336 | Tragic 69.3% |
| Guyanese | 0.0 /100 | #337 | Tragic 69.2% |
| Pima | 0.0 /100 | #338 | Tragic 69.0% |
| Immigrants | Yemen | 0.0 /100 | #339 | Tragic 68.9% |
| Menominee | 0.0 /100 | #340 | Tragic 68.7% |
| Tohono O'odham | 0.0 /100 | #341 | Tragic 68.6% |
| Immigrants | St. Vincent and the Grenadines | 0.0 /100 | #342 | Tragic 68.4% |
| Puerto Ricans | 0.0 /100 | #343 | Tragic 68.3% |
| Immigrants | Grenada | 0.0 /100 | #344 | Tragic 67.2% |
| Hopi | 0.0 /100 | #345 | Tragic 66.0% |
| Lumbee | 0.0 /100 | #346 | Tragic 65.5% |
| Navajo | 0.0 /100 | #347 | Tragic 64.8% |
Demographics Similar to Immigrants from Micronesia by In Labor Force | Age 20-24
In terms of in labor force | age 20-24, the demographic groups most similar to Immigrants from Micronesia are Belgian (77.8%, a difference of 0.040%), Tongan (77.9%, a difference of 0.12%), Slovak (77.7%, a difference of 0.12%), Tlingit-Haida (77.9%, a difference of 0.14%), and Swiss (77.7%, a difference of 0.14%).
| Demographics | Rating | Rank | In Labor Force | Age 20-24 |
| French Canadians | 100.0 /100 | #20 | Exceptional 78.1% |
| Puget Sound Salish | 100.0 /100 | #21 | Exceptional 78.0% |
| Pennsylvania Germans | 100.0 /100 | #22 | Exceptional 78.0% |
| Yugoslavians | 100.0 /100 | #23 | Exceptional 78.0% |
| Liberians | 100.0 /100 | #24 | Exceptional 78.0% |
| Tlingit-Haida | 100.0 /100 | #25 | Exceptional 77.9% |
| Tongans | 100.0 /100 | #26 | Exceptional 77.9% |
| Immigrants | Micronesia | 100.0 /100 | #27 | Exceptional 77.8% |
| Belgians | 100.0 /100 | #28 | Exceptional 77.8% |
| Slovaks | 100.0 /100 | #29 | Exceptional 77.7% |
| Swiss | 100.0 /100 | #30 | Exceptional 77.7% |
| Poles | 100.0 /100 | #31 | Exceptional 77.6% |
| English | 100.0 /100 | #32 | Exceptional 77.6% |
| Immigrants | Ethiopia | 100.0 /100 | #33 | Exceptional 77.5% |
| German Russians | 100.0 /100 | #34 | Exceptional 77.5% |