Menominee vs Immigrants from Hungary In Labor Force | Age 20-24
COMPARE
Menominee
Immigrants from Hungary
In Labor Force | Age 20-24
In Labor Force | Age 20-24 Comparison
Menominee
Immigrants from Hungary
68.7%
IN LABOR FORCE | AGE 20-24
0.0/ 100
METRIC RATING
340th/ 347
METRIC RANK
74.9%
IN LABOR FORCE | AGE 20-24
35.0/ 100
METRIC RATING
184th/ 347
METRIC RANK
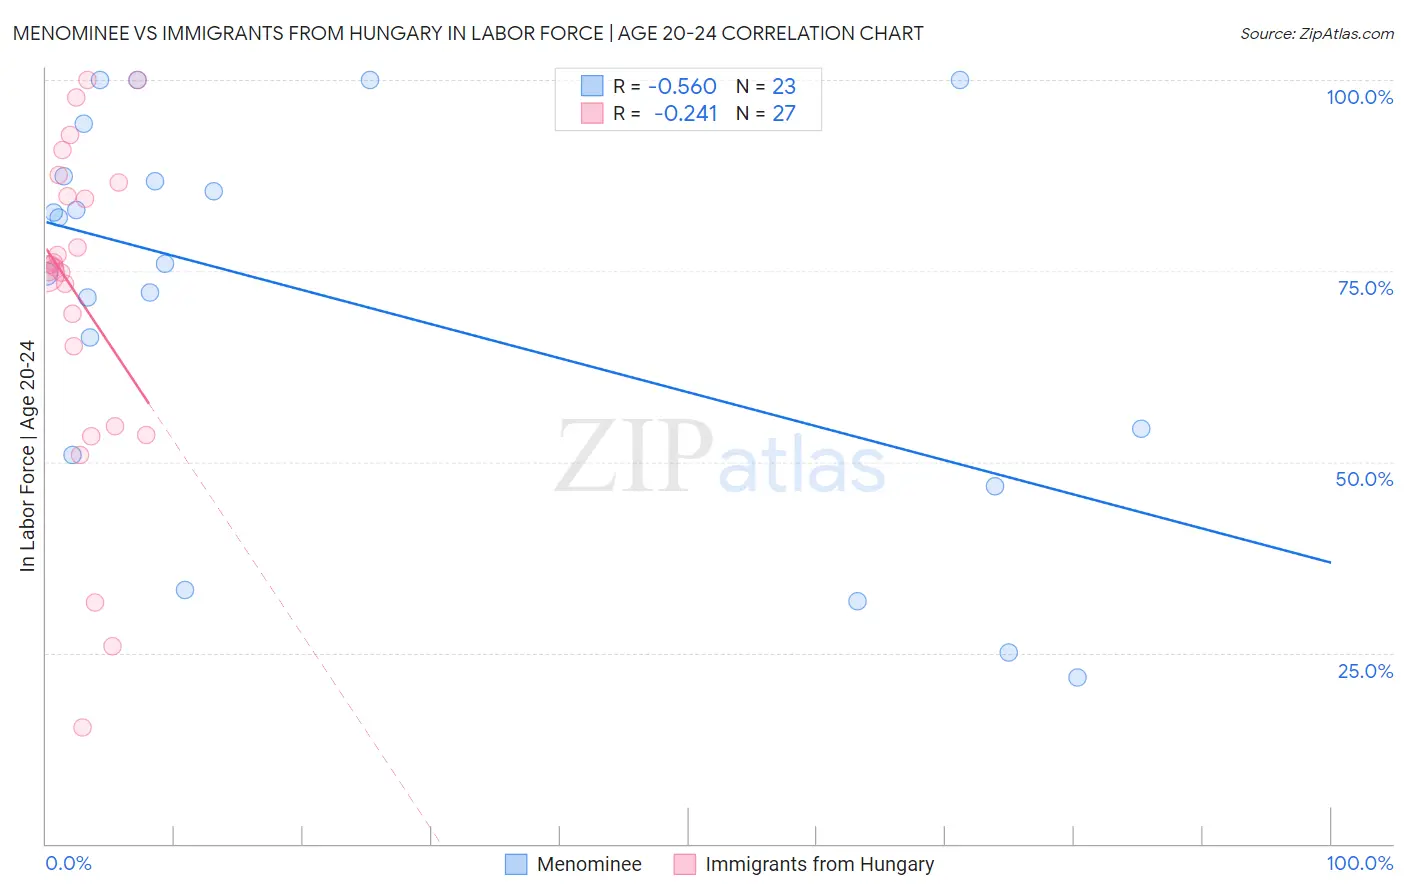
Menominee vs Immigrants from Hungary In Labor Force | Age 20-24 Correlation Chart
The statistical analysis conducted on geographies consisting of 45,776,485 people shows a substantial negative correlation between the proportion of Menominee and labor force participation rate among population between the ages 20 and 24 in the United States with a correlation coefficient (R) of -0.560 and weighted average of 68.7%. Similarly, the statistical analysis conducted on geographies consisting of 195,632,924 people shows a weak negative correlation between the proportion of Immigrants from Hungary and labor force participation rate among population between the ages 20 and 24 in the United States with a correlation coefficient (R) of -0.241 and weighted average of 74.9%, a difference of 9.0%.
In Labor Force | Age 20-24 Correlation Summary
| Measurement | Menominee | Immigrants from Hungary |
| Minimum | 21.7% | 15.2% |
| Maximum | 100.0% | 100.0% |
| Range | 78.3% | 84.8% |
| Mean | 70.7% | 71.3% |
| Median | 75.9% | 75.5% |
| Interquartile 25% (IQ1) | 50.9% | 54.6% |
| Interquartile 75% (IQ3) | 87.4% | 86.5% |
| Interquartile Range (IQR) | 36.5% | 31.9% |
| Standard Deviation (Sample) | 25.1% | 21.8% |
| Standard Deviation (Population) | 24.5% | 21.4% |
Similar Demographics by In Labor Force | Age 20-24
Demographics Similar to Menominee by In Labor Force | Age 20-24
In terms of in labor force | age 20-24, the demographic groups most similar to Menominee are Tohono O'odham (68.6%, a difference of 0.13%), Immigrants from Yemen (68.9%, a difference of 0.31%), Pima (69.0%, a difference of 0.44%), Immigrants from St. Vincent and the Grenadines (68.4%, a difference of 0.44%), and Puerto Rican (68.3%, a difference of 0.56%).
| Demographics | Rating | Rank | In Labor Force | Age 20-24 |
| Yuman | 0.0 /100 | #333 | Tragic 70.3% |
| British West Indians | 0.0 /100 | #334 | Tragic 70.0% |
| Immigrants | Barbados | 0.0 /100 | #335 | Tragic 69.7% |
| Immigrants | Guyana | 0.0 /100 | #336 | Tragic 69.3% |
| Guyanese | 0.0 /100 | #337 | Tragic 69.2% |
| Pima | 0.0 /100 | #338 | Tragic 69.0% |
| Immigrants | Yemen | 0.0 /100 | #339 | Tragic 68.9% |
| Menominee | 0.0 /100 | #340 | Tragic 68.7% |
| Tohono O'odham | 0.0 /100 | #341 | Tragic 68.6% |
| Immigrants | St. Vincent and the Grenadines | 0.0 /100 | #342 | Tragic 68.4% |
| Puerto Ricans | 0.0 /100 | #343 | Tragic 68.3% |
| Immigrants | Grenada | 0.0 /100 | #344 | Tragic 67.2% |
| Hopi | 0.0 /100 | #345 | Tragic 66.0% |
| Lumbee | 0.0 /100 | #346 | Tragic 65.5% |
| Navajo | 0.0 /100 | #347 | Tragic 64.8% |
Demographics Similar to Immigrants from Hungary by In Labor Force | Age 20-24
In terms of in labor force | age 20-24, the demographic groups most similar to Immigrants from Hungary are Sri Lankan (74.9%, a difference of 0.0%), Immigrants from Eastern Europe (74.9%, a difference of 0.020%), Immigrants from Honduras (74.9%, a difference of 0.020%), Immigrants from South Africa (74.9%, a difference of 0.030%), and Immigrants from Costa Rica (74.9%, a difference of 0.030%).
| Demographics | Rating | Rank | In Labor Force | Age 20-24 |
| Immigrants | Mexico | 47.8 /100 | #177 | Average 75.0% |
| Immigrants | Central America | 45.0 /100 | #178 | Average 75.0% |
| Immigrants | Latvia | 44.1 /100 | #179 | Average 75.0% |
| Immigrants | Czechoslovakia | 44.0 /100 | #180 | Average 75.0% |
| Africans | 42.5 /100 | #181 | Average 75.0% |
| Immigrants | South Africa | 36.9 /100 | #182 | Fair 74.9% |
| Immigrants | Costa Rica | 36.7 /100 | #183 | Fair 74.9% |
| Immigrants | Hungary | 35.0 /100 | #184 | Fair 74.9% |
| Sri Lankans | 34.9 /100 | #185 | Fair 74.9% |
| Immigrants | Eastern Europe | 33.8 /100 | #186 | Fair 74.9% |
| Immigrants | Honduras | 33.5 /100 | #187 | Fair 74.9% |
| Hondurans | 32.7 /100 | #188 | Fair 74.8% |
| Immigrants | Northern Europe | 32.6 /100 | #189 | Fair 74.8% |
| Russians | 32.2 /100 | #190 | Fair 74.8% |
| Senegalese | 28.1 /100 | #191 | Fair 74.8% |