Menominee vs Costa Rican In Labor Force | Age 20-24
COMPARE
Menominee
Costa Rican
In Labor Force | Age 20-24
In Labor Force | Age 20-24 Comparison
Menominee
Costa Ricans
68.7%
IN LABOR FORCE | AGE 20-24
0.0/ 100
METRIC RATING
340th/ 347
METRIC RANK
75.2%
IN LABOR FORCE | AGE 20-24
64.2/ 100
METRIC RATING
163rd/ 347
METRIC RANK
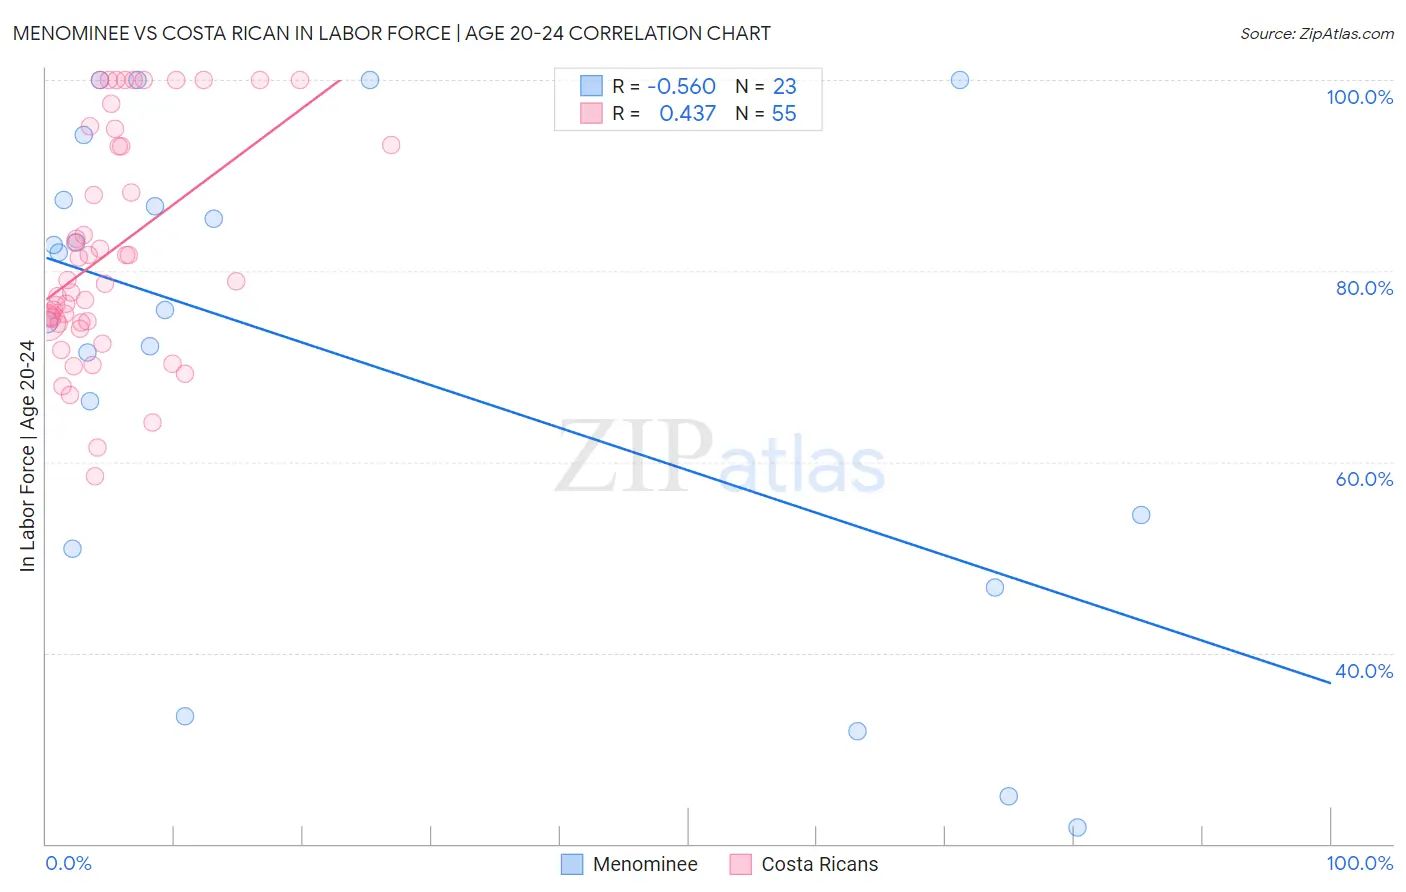
Menominee vs Costa Rican In Labor Force | Age 20-24 Correlation Chart
The statistical analysis conducted on geographies consisting of 45,776,485 people shows a substantial negative correlation between the proportion of Menominee and labor force participation rate among population between the ages 20 and 24 in the United States with a correlation coefficient (R) of -0.560 and weighted average of 68.7%. Similarly, the statistical analysis conducted on geographies consisting of 253,576,845 people shows a moderate positive correlation between the proportion of Costa Ricans and labor force participation rate among population between the ages 20 and 24 in the United States with a correlation coefficient (R) of 0.437 and weighted average of 75.2%, a difference of 9.5%.
In Labor Force | Age 20-24 Correlation Summary
| Measurement | Menominee | Costa Rican |
| Minimum | 21.7% | 58.4% |
| Maximum | 100.0% | 100.0% |
| Range | 78.3% | 41.6% |
| Mean | 70.7% | 82.1% |
| Median | 75.9% | 78.9% |
| Interquartile 25% (IQ1) | 50.9% | 74.6% |
| Interquartile 75% (IQ3) | 87.4% | 93.2% |
| Interquartile Range (IQR) | 36.5% | 18.6% |
| Standard Deviation (Sample) | 25.1% | 11.7% |
| Standard Deviation (Population) | 24.5% | 11.6% |
Similar Demographics by In Labor Force | Age 20-24
Demographics Similar to Menominee by In Labor Force | Age 20-24
In terms of in labor force | age 20-24, the demographic groups most similar to Menominee are Tohono O'odham (68.6%, a difference of 0.13%), Immigrants from Yemen (68.9%, a difference of 0.31%), Pima (69.0%, a difference of 0.44%), Immigrants from St. Vincent and the Grenadines (68.4%, a difference of 0.44%), and Puerto Rican (68.3%, a difference of 0.56%).
| Demographics | Rating | Rank | In Labor Force | Age 20-24 |
| Yuman | 0.0 /100 | #333 | Tragic 70.3% |
| British West Indians | 0.0 /100 | #334 | Tragic 70.0% |
| Immigrants | Barbados | 0.0 /100 | #335 | Tragic 69.7% |
| Immigrants | Guyana | 0.0 /100 | #336 | Tragic 69.3% |
| Guyanese | 0.0 /100 | #337 | Tragic 69.2% |
| Pima | 0.0 /100 | #338 | Tragic 69.0% |
| Immigrants | Yemen | 0.0 /100 | #339 | Tragic 68.9% |
| Menominee | 0.0 /100 | #340 | Tragic 68.7% |
| Tohono O'odham | 0.0 /100 | #341 | Tragic 68.6% |
| Immigrants | St. Vincent and the Grenadines | 0.0 /100 | #342 | Tragic 68.4% |
| Puerto Ricans | 0.0 /100 | #343 | Tragic 68.3% |
| Immigrants | Grenada | 0.0 /100 | #344 | Tragic 67.2% |
| Hopi | 0.0 /100 | #345 | Tragic 66.0% |
| Lumbee | 0.0 /100 | #346 | Tragic 65.5% |
| Navajo | 0.0 /100 | #347 | Tragic 64.8% |
Demographics Similar to Costa Ricans by In Labor Force | Age 20-24
In terms of in labor force | age 20-24, the demographic groups most similar to Costa Ricans are Bolivian (75.2%, a difference of 0.0%), Immigrants from Romania (75.2%, a difference of 0.010%), Afghan (75.2%, a difference of 0.010%), New Zealander (75.2%, a difference of 0.020%), and Cambodian (75.2%, a difference of 0.060%).
| Demographics | Rating | Rank | In Labor Force | Age 20-24 |
| Immigrants | El Salvador | 71.7 /100 | #156 | Good 75.3% |
| Immigrants | Western Europe | 71.5 /100 | #157 | Good 75.3% |
| Immigrants | Bolivia | 71.0 /100 | #158 | Good 75.3% |
| South American Indians | 69.0 /100 | #159 | Good 75.3% |
| Japanese | 68.7 /100 | #160 | Good 75.3% |
| New Zealanders | 65.4 /100 | #161 | Good 75.2% |
| Immigrants | Romania | 64.6 /100 | #162 | Good 75.2% |
| Costa Ricans | 64.2 /100 | #163 | Good 75.2% |
| Bolivians | 64.0 /100 | #164 | Good 75.2% |
| Afghans | 63.5 /100 | #165 | Good 75.2% |
| Cambodians | 60.5 /100 | #166 | Good 75.2% |
| Immigrants | South Eastern Asia | 57.5 /100 | #167 | Average 75.1% |
| Immigrants | Western Africa | 56.7 /100 | #168 | Average 75.1% |
| Immigrants | Philippines | 55.8 /100 | #169 | Average 75.1% |
| Mexicans | 52.1 /100 | #170 | Average 75.1% |