Menominee vs Navajo In Labor Force | Age 20-24
COMPARE
Menominee
Navajo
In Labor Force | Age 20-24
In Labor Force | Age 20-24 Comparison
Menominee
Navajo
68.7%
IN LABOR FORCE | AGE 20-24
0.0/ 100
METRIC RATING
340th/ 347
METRIC RANK
64.8%
IN LABOR FORCE | AGE 20-24
0.0/ 100
METRIC RATING
347th/ 347
METRIC RANK
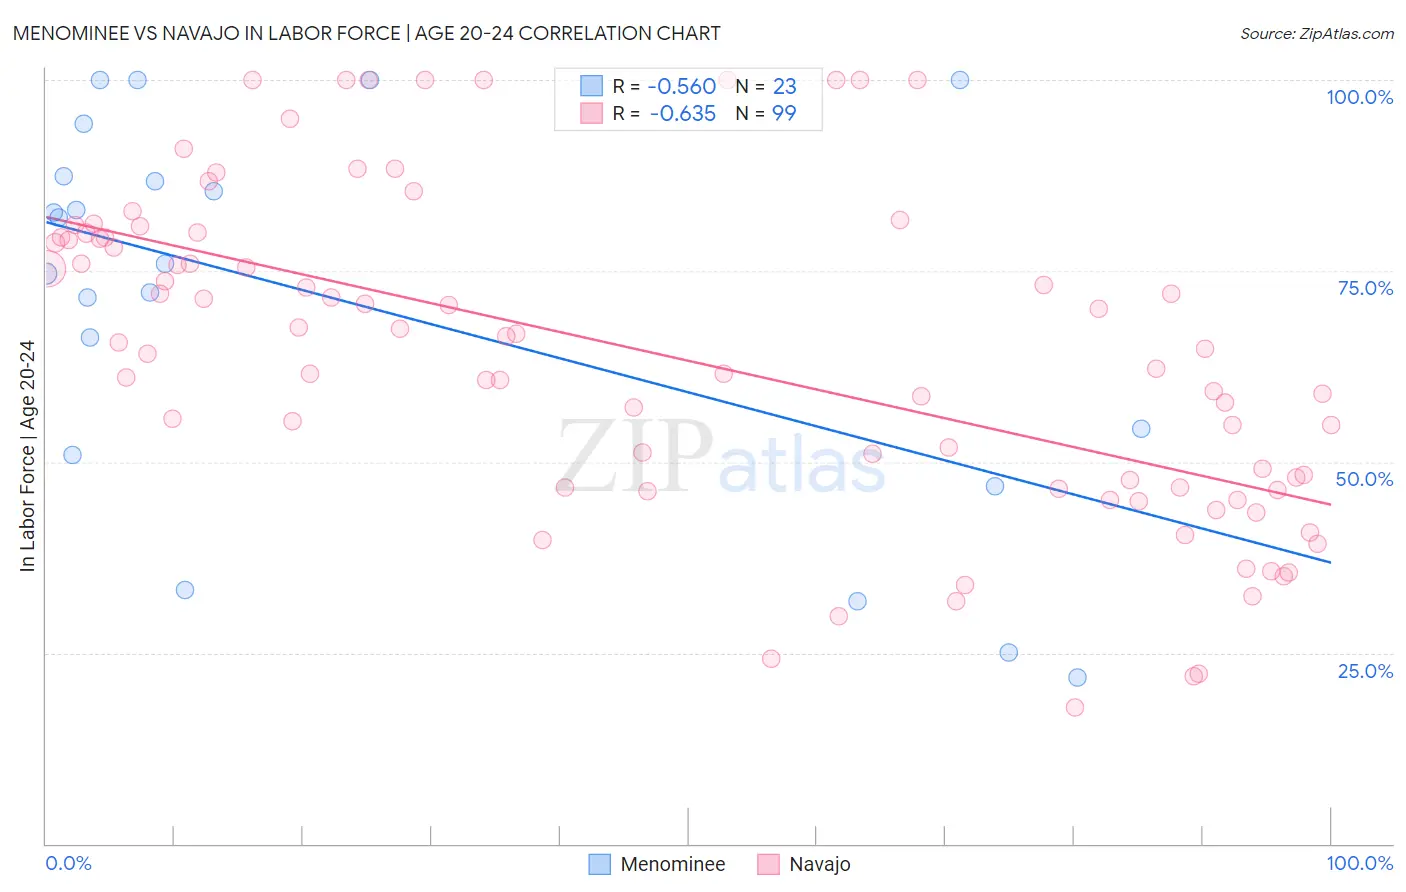
Menominee vs Navajo In Labor Force | Age 20-24 Correlation Chart
The statistical analysis conducted on geographies consisting of 45,776,485 people shows a substantial negative correlation between the proportion of Menominee and labor force participation rate among population between the ages 20 and 24 in the United States with a correlation coefficient (R) of -0.560 and weighted average of 68.7%. Similarly, the statistical analysis conducted on geographies consisting of 224,781,788 people shows a significant negative correlation between the proportion of Navajo and labor force participation rate among population between the ages 20 and 24 in the United States with a correlation coefficient (R) of -0.635 and weighted average of 64.8%, a difference of 6.0%.
In Labor Force | Age 20-24 Correlation Summary
| Measurement | Menominee | Navajo |
| Minimum | 21.7% | 17.9% |
| Maximum | 100.0% | 100.0% |
| Range | 78.3% | 82.1% |
| Mean | 70.7% | 63.8% |
| Median | 75.9% | 64.7% |
| Interquartile 25% (IQ1) | 50.9% | 46.6% |
| Interquartile 75% (IQ3) | 87.4% | 79.4% |
| Interquartile Range (IQR) | 36.5% | 32.8% |
| Standard Deviation (Sample) | 25.1% | 21.0% |
| Standard Deviation (Population) | 24.5% | 20.9% |
Demographics Similar to Menominee and Navajo by In Labor Force | Age 20-24
In terms of in labor force | age 20-24, the demographic groups most similar to Menominee are Tohono O'odham (68.6%, a difference of 0.13%), Immigrants from Yemen (68.9%, a difference of 0.31%), Pima (69.0%, a difference of 0.44%), Immigrants from St. Vincent and the Grenadines (68.4%, a difference of 0.44%), and Puerto Rican (68.3%, a difference of 0.56%). Similarly, the demographic groups most similar to Navajo are Lumbee (65.5%, a difference of 1.1%), Hopi (66.0%, a difference of 1.8%), Immigrants from Grenada (67.2%, a difference of 3.6%), Puerto Rican (68.3%, a difference of 5.4%), and Immigrants from St. Vincent and the Grenadines (68.4%, a difference of 5.5%).
| Demographics | Rating | Rank | In Labor Force | Age 20-24 |
| Immigrants | China | 0.0 /100 | #328 | Tragic 71.1% |
| Yup'ik | 0.0 /100 | #329 | Tragic 70.9% |
| Vietnamese | 0.0 /100 | #330 | Tragic 70.6% |
| Immigrants | Bangladesh | 0.0 /100 | #331 | Tragic 70.6% |
| Immigrants | Uzbekistan | 0.0 /100 | #332 | Tragic 70.4% |
| Yuman | 0.0 /100 | #333 | Tragic 70.3% |
| British West Indians | 0.0 /100 | #334 | Tragic 70.0% |
| Immigrants | Barbados | 0.0 /100 | #335 | Tragic 69.7% |
| Immigrants | Guyana | 0.0 /100 | #336 | Tragic 69.3% |
| Guyanese | 0.0 /100 | #337 | Tragic 69.2% |
| Pima | 0.0 /100 | #338 | Tragic 69.0% |
| Immigrants | Yemen | 0.0 /100 | #339 | Tragic 68.9% |
| Menominee | 0.0 /100 | #340 | Tragic 68.7% |
| Tohono O'odham | 0.0 /100 | #341 | Tragic 68.6% |
| Immigrants | St. Vincent and the Grenadines | 0.0 /100 | #342 | Tragic 68.4% |
| Puerto Ricans | 0.0 /100 | #343 | Tragic 68.3% |
| Immigrants | Grenada | 0.0 /100 | #344 | Tragic 67.2% |
| Hopi | 0.0 /100 | #345 | Tragic 66.0% |
| Lumbee | 0.0 /100 | #346 | Tragic 65.5% |
| Navajo | 0.0 /100 | #347 | Tragic 64.8% |