Scotch-Irish vs Immigrants from Denmark In Labor Force | Age 30-34
COMPARE
Scotch-Irish
Immigrants from Denmark
In Labor Force | Age 30-34
In Labor Force | Age 30-34 Comparison
Scotch-Irish
Immigrants from Denmark
83.8%
IN LABOR FORCE | AGE 30-34
0.3/ 100
METRIC RATING
259th/ 347
METRIC RANK
85.1%
IN LABOR FORCE | AGE 30-34
94.3/ 100
METRIC RATING
117th/ 347
METRIC RANK
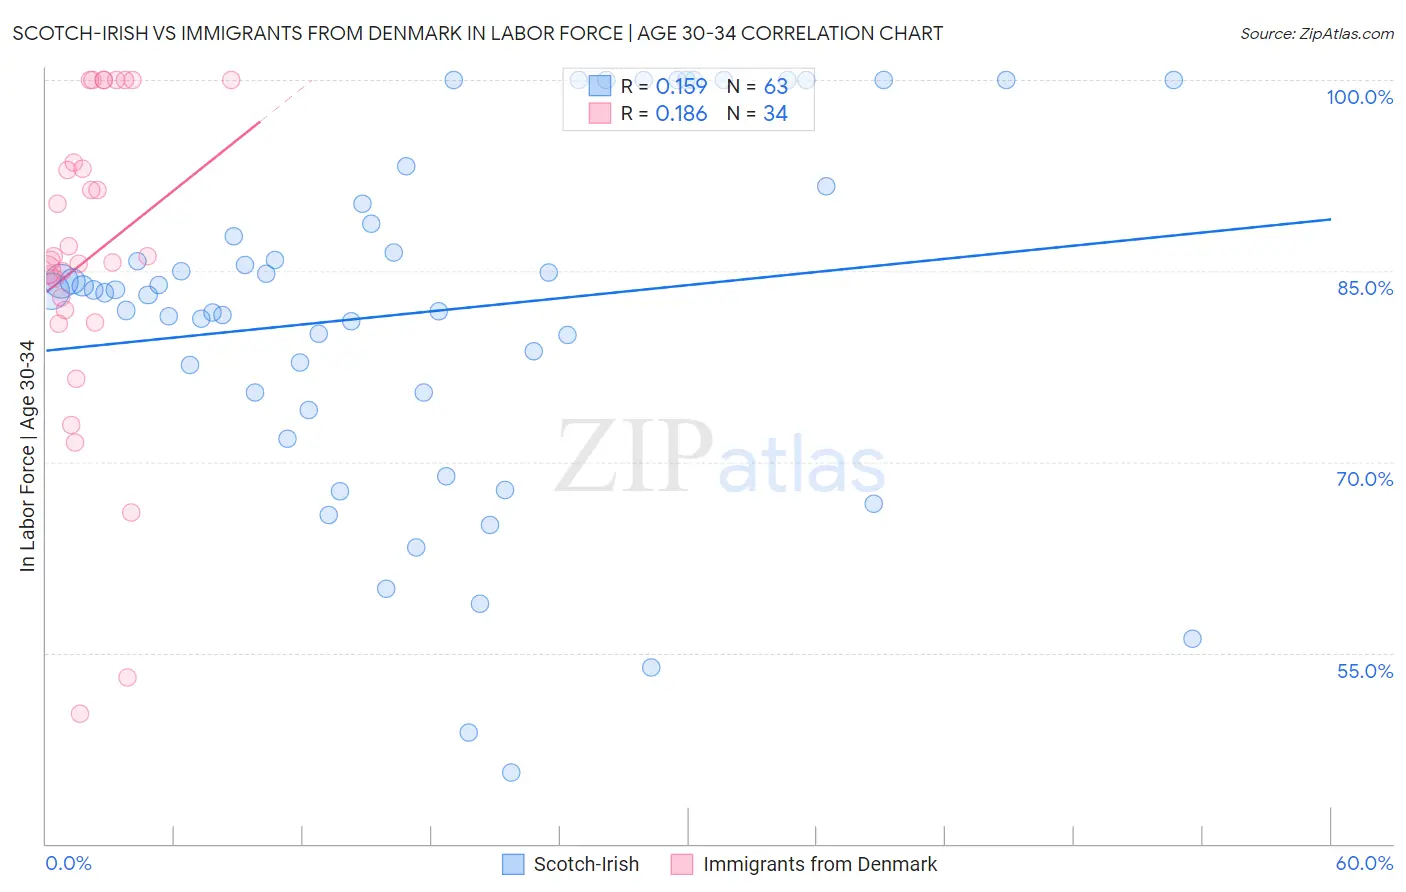
Scotch-Irish vs Immigrants from Denmark In Labor Force | Age 30-34 Correlation Chart
The statistical analysis conducted on geographies consisting of 547,840,713 people shows a poor positive correlation between the proportion of Scotch-Irish and labor force participation rate among population between the ages 30 and 34 in the United States with a correlation coefficient (R) of 0.159 and weighted average of 83.8%. Similarly, the statistical analysis conducted on geographies consisting of 136,406,477 people shows a poor positive correlation between the proportion of Immigrants from Denmark and labor force participation rate among population between the ages 30 and 34 in the United States with a correlation coefficient (R) of 0.186 and weighted average of 85.1%, a difference of 1.5%.
In Labor Force | Age 30-34 Correlation Summary
| Measurement | Scotch-Irish | Immigrants from Denmark |
| Minimum | 45.6% | 50.2% |
| Maximum | 100.0% | 100.0% |
| Range | 54.4% | 49.8% |
| Mean | 81.8% | 86.0% |
| Median | 83.4% | 86.0% |
| Interquartile 25% (IQ1) | 75.4% | 81.9% |
| Interquartile 75% (IQ3) | 90.3% | 93.5% |
| Interquartile Range (IQR) | 14.8% | 11.6% |
| Standard Deviation (Sample) | 13.7% | 12.5% |
| Standard Deviation (Population) | 13.6% | 12.3% |
Similar Demographics by In Labor Force | Age 30-34
Demographics Similar to Scotch-Irish by In Labor Force | Age 30-34
In terms of in labor force | age 30-34, the demographic groups most similar to Scotch-Irish are Honduran (83.8%, a difference of 0.0%), Immigrants from Dominican Republic (83.8%, a difference of 0.020%), Guyanese (83.8%, a difference of 0.020%), Iraqi (83.8%, a difference of 0.030%), and Dominican (83.8%, a difference of 0.040%).
| Demographics | Rating | Rank | In Labor Force | Age 30-34 |
| Bahamians | 0.6 /100 | #252 | Tragic 83.9% |
| Immigrants | Nicaragua | 0.6 /100 | #253 | Tragic 83.9% |
| Immigrants | St. Vincent and the Grenadines | 0.5 /100 | #254 | Tragic 83.9% |
| Whites/Caucasians | 0.5 /100 | #255 | Tragic 83.9% |
| Immigrants | Lebanon | 0.4 /100 | #256 | Tragic 83.9% |
| Iraqis | 0.3 /100 | #257 | Tragic 83.8% |
| Hondurans | 0.3 /100 | #258 | Tragic 83.8% |
| Scotch-Irish | 0.3 /100 | #259 | Tragic 83.8% |
| Immigrants | Dominican Republic | 0.3 /100 | #260 | Tragic 83.8% |
| Guyanese | 0.3 /100 | #261 | Tragic 83.8% |
| Dominicans | 0.2 /100 | #262 | Tragic 83.8% |
| Immigrants | Guyana | 0.2 /100 | #263 | Tragic 83.8% |
| Guatemalans | 0.2 /100 | #264 | Tragic 83.7% |
| Immigrants | Honduras | 0.1 /100 | #265 | Tragic 83.7% |
| Immigrants | Guatemala | 0.1 /100 | #266 | Tragic 83.7% |
Demographics Similar to Immigrants from Denmark by In Labor Force | Age 30-34
In terms of in labor force | age 30-34, the demographic groups most similar to Immigrants from Denmark are Immigrants from Malaysia (85.1%, a difference of 0.0%), Immigrants from Romania (85.1%, a difference of 0.010%), Yugoslavian (85.1%, a difference of 0.010%), Immigrants from South Central Asia (85.1%, a difference of 0.010%), and Egyptian (85.1%, a difference of 0.010%).
| Demographics | Rating | Rank | In Labor Force | Age 30-34 |
| Immigrants | South Africa | 95.3 /100 | #110 | Exceptional 85.1% |
| Immigrants | Scotland | 94.9 /100 | #111 | Exceptional 85.1% |
| Immigrants | Hungary | 94.8 /100 | #112 | Exceptional 85.1% |
| Immigrants | Romania | 94.7 /100 | #113 | Exceptional 85.1% |
| Yugoslavians | 94.7 /100 | #114 | Exceptional 85.1% |
| Immigrants | South Central Asia | 94.6 /100 | #115 | Exceptional 85.1% |
| Egyptians | 94.5 /100 | #116 | Exceptional 85.1% |
| Immigrants | Denmark | 94.3 /100 | #117 | Exceptional 85.1% |
| Immigrants | Malaysia | 94.2 /100 | #118 | Exceptional 85.1% |
| Asians | 93.4 /100 | #119 | Exceptional 85.1% |
| Immigrants | Southern Europe | 93.3 /100 | #120 | Exceptional 85.1% |
| Immigrants | Egypt | 93.2 /100 | #121 | Exceptional 85.1% |
| Immigrants | Kuwait | 92.6 /100 | #122 | Exceptional 85.1% |
| Armenians | 92.2 /100 | #123 | Exceptional 85.0% |
| Australians | 92.0 /100 | #124 | Exceptional 85.0% |