Luxembourger vs Immigrants from Armenia In Labor Force | Age 30-34
COMPARE
Luxembourger
Immigrants from Armenia
In Labor Force | Age 30-34
In Labor Force | Age 30-34 Comparison
Luxembourgers
Immigrants from Armenia
86.6%
IN LABOR FORCE | AGE 30-34
100.0/ 100
METRIC RATING
1st/ 347
METRIC RANK
84.8%
IN LABOR FORCE | AGE 30-34
64.7/ 100
METRIC RATING
158th/ 347
METRIC RANK
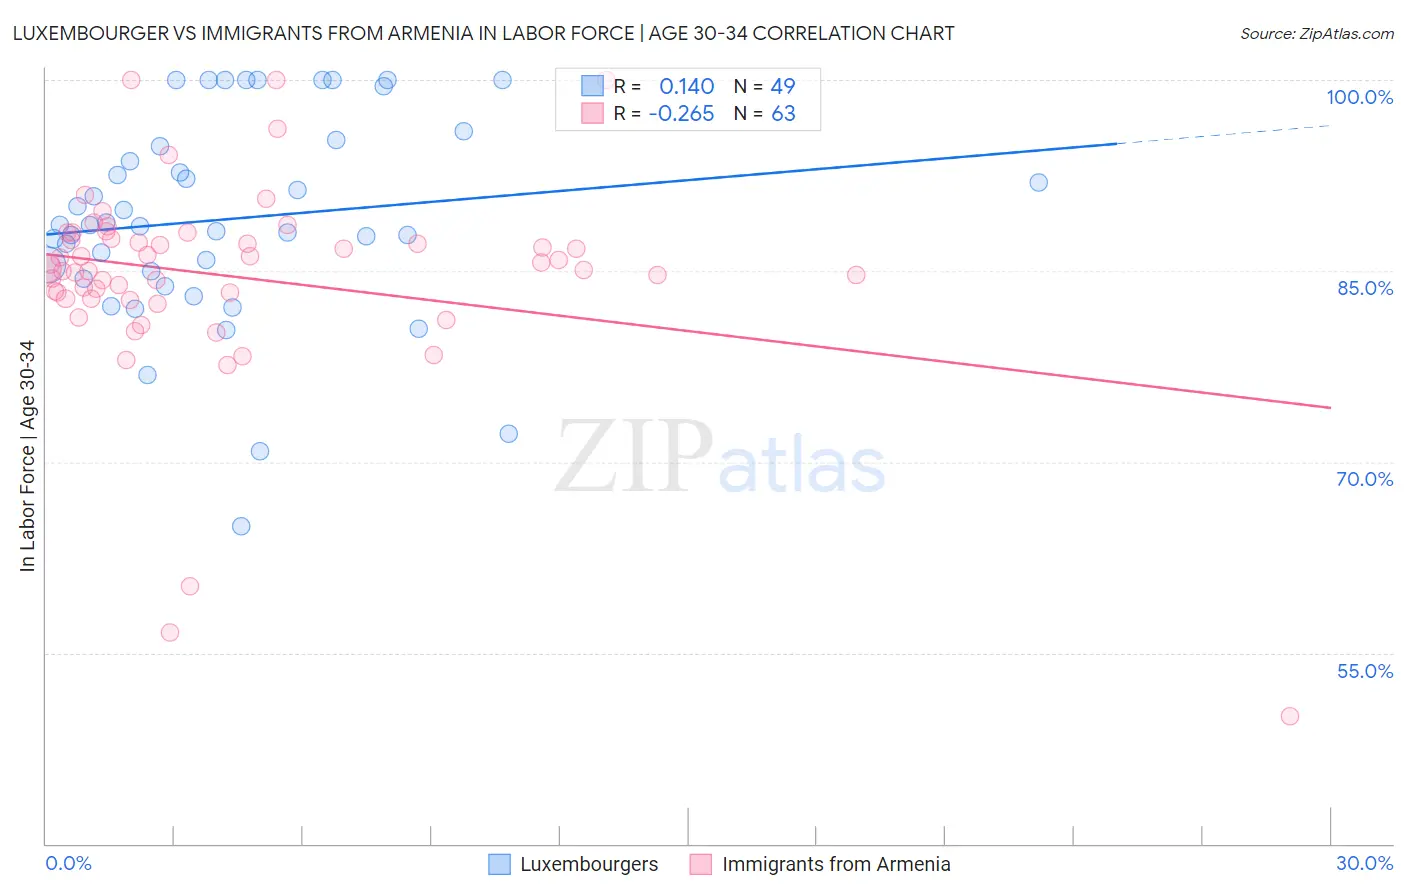
Luxembourger vs Immigrants from Armenia In Labor Force | Age 30-34 Correlation Chart
The statistical analysis conducted on geographies consisting of 144,656,260 people shows a poor positive correlation between the proportion of Luxembourgers and labor force participation rate among population between the ages 30 and 34 in the United States with a correlation coefficient (R) of 0.140 and weighted average of 86.6%. Similarly, the statistical analysis conducted on geographies consisting of 97,710,300 people shows a weak negative correlation between the proportion of Immigrants from Armenia and labor force participation rate among population between the ages 30 and 34 in the United States with a correlation coefficient (R) of -0.265 and weighted average of 84.8%, a difference of 2.2%.
In Labor Force | Age 30-34 Correlation Summary
| Measurement | Luxembourger | Immigrants from Armenia |
| Minimum | 64.9% | 50.0% |
| Maximum | 100.0% | 100.0% |
| Range | 35.1% | 50.0% |
| Mean | 89.1% | 84.6% |
| Median | 88.6% | 85.2% |
| Interquartile 25% (IQ1) | 84.7% | 82.9% |
| Interquartile 75% (IQ3) | 95.1% | 87.5% |
| Interquartile Range (IQR) | 10.4% | 4.6% |
| Standard Deviation (Sample) | 8.1% | 8.1% |
| Standard Deviation (Population) | 8.0% | 8.0% |
Similar Demographics by In Labor Force | Age 30-34
Demographics Similar to Luxembourgers by In Labor Force | Age 30-34
In terms of in labor force | age 30-34, the demographic groups most similar to Luxembourgers are Ethiopian (86.6%, a difference of 0.070%), Immigrants from Ethiopia (86.6%, a difference of 0.080%), Liberian (86.4%, a difference of 0.28%), Immigrants from Ireland (86.3%, a difference of 0.42%), and Somali (86.2%, a difference of 0.45%).
| Demographics | Rating | Rank | In Labor Force | Age 30-34 |
| Luxembourgers | 100.0 /100 | #1 | Exceptional 86.6% |
| Ethiopians | 100.0 /100 | #2 | Exceptional 86.6% |
| Immigrants | Ethiopia | 100.0 /100 | #3 | Exceptional 86.6% |
| Liberians | 100.0 /100 | #4 | Exceptional 86.4% |
| Immigrants | Ireland | 100.0 /100 | #5 | Exceptional 86.3% |
| Somalis | 100.0 /100 | #6 | Exceptional 86.2% |
| Immigrants | Bolivia | 100.0 /100 | #7 | Exceptional 86.2% |
| Cambodians | 100.0 /100 | #8 | Exceptional 86.2% |
| Immigrants | Somalia | 100.0 /100 | #9 | Exceptional 86.2% |
| Immigrants | Serbia | 100.0 /100 | #10 | Exceptional 86.2% |
| Carpatho Rusyns | 100.0 /100 | #11 | Exceptional 86.2% |
| Bolivians | 100.0 /100 | #12 | Exceptional 86.1% |
| Immigrants | Croatia | 100.0 /100 | #13 | Exceptional 86.1% |
| Immigrants | Cabo Verde | 100.0 /100 | #14 | Exceptional 86.1% |
| Immigrants | Albania | 100.0 /100 | #15 | Exceptional 86.1% |
Demographics Similar to Immigrants from Armenia by In Labor Force | Age 30-34
In terms of in labor force | age 30-34, the demographic groups most similar to Immigrants from Armenia are Peruvian (84.8%, a difference of 0.010%), Czechoslovakian (84.8%, a difference of 0.010%), French Canadian (84.8%, a difference of 0.020%), Pakistani (84.7%, a difference of 0.030%), and Immigrants from Cambodia (84.7%, a difference of 0.030%).
| Demographics | Rating | Rank | In Labor Force | Age 30-34 |
| Immigrants | Senegal | 74.0 /100 | #151 | Good 84.8% |
| Romanians | 73.5 /100 | #152 | Good 84.8% |
| Syrians | 70.1 /100 | #153 | Good 84.8% |
| Northern Europeans | 70.0 /100 | #154 | Good 84.8% |
| Immigrants | Sudan | 69.5 /100 | #155 | Good 84.8% |
| French Canadians | 67.3 /100 | #156 | Good 84.8% |
| Peruvians | 65.9 /100 | #157 | Good 84.8% |
| Immigrants | Armenia | 64.7 /100 | #158 | Good 84.8% |
| Czechoslovakians | 63.0 /100 | #159 | Good 84.8% |
| Pakistanis | 60.8 /100 | #160 | Good 84.7% |
| Immigrants | Cambodia | 60.7 /100 | #161 | Good 84.7% |
| South Americans | 58.7 /100 | #162 | Average 84.7% |
| Immigrants | Uruguay | 57.4 /100 | #163 | Average 84.7% |
| Icelanders | 56.8 /100 | #164 | Average 84.7% |
| Immigrants | Western Europe | 56.7 /100 | #165 | Average 84.7% |