Bermudan vs Immigrants from Denmark In Labor Force | Age 30-34
COMPARE
Bermudan
Immigrants from Denmark
In Labor Force | Age 30-34
In Labor Force | Age 30-34 Comparison
Bermudans
Immigrants from Denmark
85.9%
IN LABOR FORCE | AGE 30-34
100.0/ 100
METRIC RATING
22nd/ 347
METRIC RANK
85.1%
IN LABOR FORCE | AGE 30-34
94.3/ 100
METRIC RATING
117th/ 347
METRIC RANK
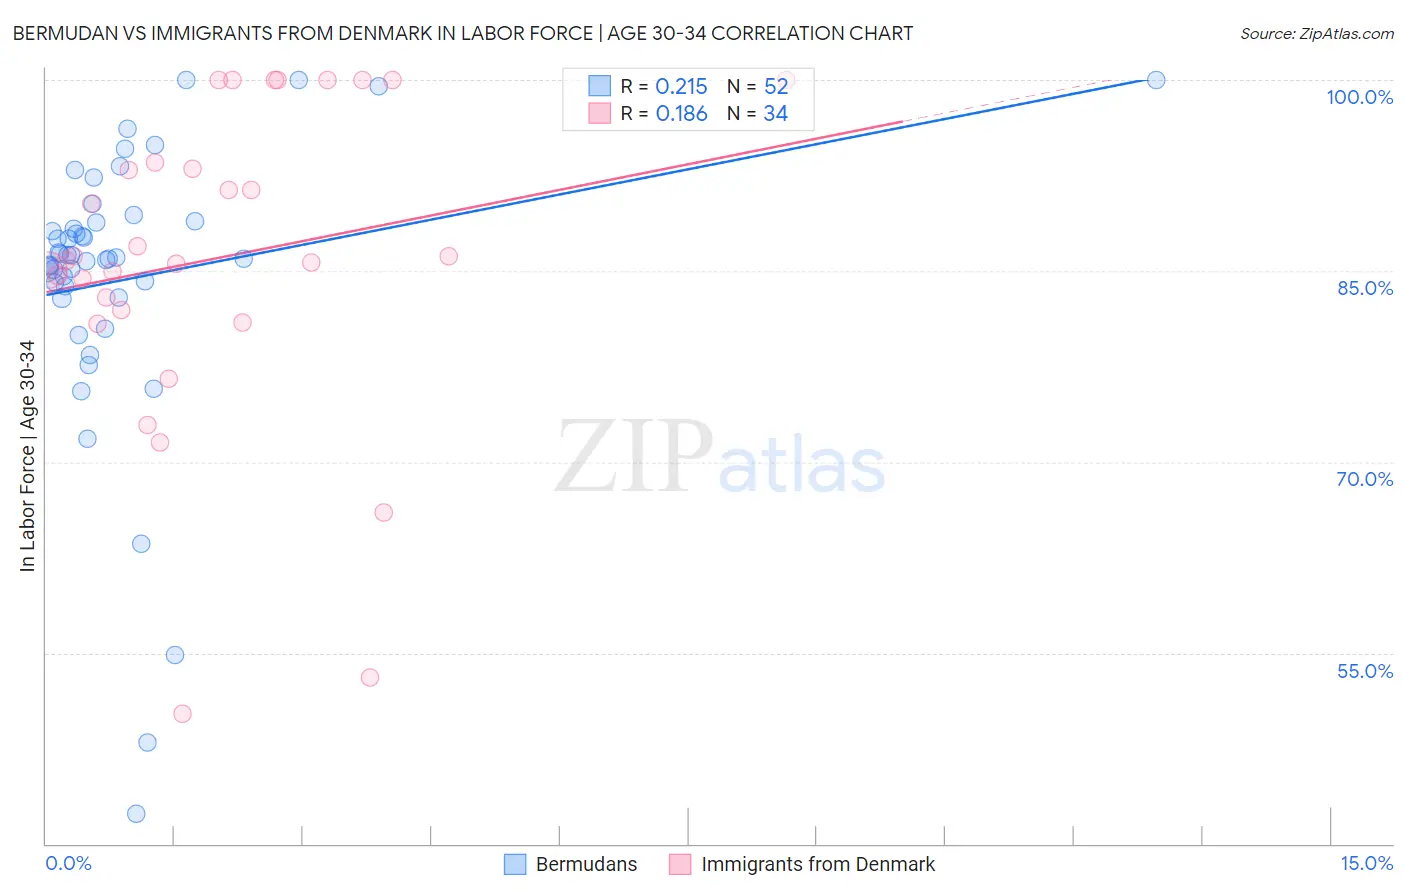
Bermudan vs Immigrants from Denmark In Labor Force | Age 30-34 Correlation Chart
The statistical analysis conducted on geographies consisting of 55,725,453 people shows a weak positive correlation between the proportion of Bermudans and labor force participation rate among population between the ages 30 and 34 in the United States with a correlation coefficient (R) of 0.215 and weighted average of 85.9%. Similarly, the statistical analysis conducted on geographies consisting of 136,406,477 people shows a poor positive correlation between the proportion of Immigrants from Denmark and labor force participation rate among population between the ages 30 and 34 in the United States with a correlation coefficient (R) of 0.186 and weighted average of 85.1%, a difference of 0.99%.
In Labor Force | Age 30-34 Correlation Summary
| Measurement | Bermudan | Immigrants from Denmark |
| Minimum | 42.4% | 50.2% |
| Maximum | 100.0% | 100.0% |
| Range | 57.6% | 49.8% |
| Mean | 84.4% | 86.0% |
| Median | 86.0% | 86.0% |
| Interquartile 25% (IQ1) | 83.3% | 81.9% |
| Interquartile 75% (IQ3) | 88.8% | 93.5% |
| Interquartile Range (IQR) | 5.5% | 11.6% |
| Standard Deviation (Sample) | 11.4% | 12.5% |
| Standard Deviation (Population) | 11.2% | 12.3% |
Similar Demographics by In Labor Force | Age 30-34
Demographics Similar to Bermudans by In Labor Force | Age 30-34
In terms of in labor force | age 30-34, the demographic groups most similar to Bermudans are Estonian (85.9%, a difference of 0.0%), Immigrants from Eritrea (85.9%, a difference of 0.010%), Bulgarian (86.0%, a difference of 0.020%), Immigrants from Bulgaria (86.0%, a difference of 0.020%), and Immigrants from North Macedonia (85.9%, a difference of 0.020%).
| Demographics | Rating | Rank | In Labor Force | Age 30-34 |
| Immigrants | Albania | 100.0 /100 | #15 | Exceptional 86.1% |
| Latvians | 100.0 /100 | #16 | Exceptional 86.0% |
| Immigrants | Cameroon | 100.0 /100 | #17 | Exceptional 86.0% |
| Immigrants | Sierra Leone | 100.0 /100 | #18 | Exceptional 86.0% |
| Sierra Leoneans | 100.0 /100 | #19 | Exceptional 86.0% |
| Bulgarians | 100.0 /100 | #20 | Exceptional 86.0% |
| Immigrants | Bulgaria | 100.0 /100 | #21 | Exceptional 86.0% |
| Bermudans | 100.0 /100 | #22 | Exceptional 85.9% |
| Estonians | 100.0 /100 | #23 | Exceptional 85.9% |
| Immigrants | Eritrea | 100.0 /100 | #24 | Exceptional 85.9% |
| Immigrants | North Macedonia | 100.0 /100 | #25 | Exceptional 85.9% |
| Immigrants | Eastern Africa | 100.0 /100 | #26 | Exceptional 85.9% |
| Immigrants | Liberia | 100.0 /100 | #27 | Exceptional 85.9% |
| Immigrants | Latvia | 100.0 /100 | #28 | Exceptional 85.9% |
| Tsimshian | 100.0 /100 | #29 | Exceptional 85.8% |
Demographics Similar to Immigrants from Denmark by In Labor Force | Age 30-34
In terms of in labor force | age 30-34, the demographic groups most similar to Immigrants from Denmark are Immigrants from Malaysia (85.1%, a difference of 0.0%), Immigrants from Romania (85.1%, a difference of 0.010%), Yugoslavian (85.1%, a difference of 0.010%), Immigrants from South Central Asia (85.1%, a difference of 0.010%), and Egyptian (85.1%, a difference of 0.010%).
| Demographics | Rating | Rank | In Labor Force | Age 30-34 |
| Immigrants | South Africa | 95.3 /100 | #110 | Exceptional 85.1% |
| Immigrants | Scotland | 94.9 /100 | #111 | Exceptional 85.1% |
| Immigrants | Hungary | 94.8 /100 | #112 | Exceptional 85.1% |
| Immigrants | Romania | 94.7 /100 | #113 | Exceptional 85.1% |
| Yugoslavians | 94.7 /100 | #114 | Exceptional 85.1% |
| Immigrants | South Central Asia | 94.6 /100 | #115 | Exceptional 85.1% |
| Egyptians | 94.5 /100 | #116 | Exceptional 85.1% |
| Immigrants | Denmark | 94.3 /100 | #117 | Exceptional 85.1% |
| Immigrants | Malaysia | 94.2 /100 | #118 | Exceptional 85.1% |
| Asians | 93.4 /100 | #119 | Exceptional 85.1% |
| Immigrants | Southern Europe | 93.3 /100 | #120 | Exceptional 85.1% |
| Immigrants | Egypt | 93.2 /100 | #121 | Exceptional 85.1% |
| Immigrants | Kuwait | 92.6 /100 | #122 | Exceptional 85.1% |
| Armenians | 92.2 /100 | #123 | Exceptional 85.0% |
| Australians | 92.0 /100 | #124 | Exceptional 85.0% |