Immigrants from Northern Africa vs Immigrants from Denmark In Labor Force | Age 30-34
COMPARE
Immigrants from Northern Africa
Immigrants from Denmark
In Labor Force | Age 30-34
In Labor Force | Age 30-34 Comparison
Immigrants from Northern Africa
Immigrants from Denmark
85.2%
IN LABOR FORCE | AGE 30-34
96.3/ 100
METRIC RATING
107th/ 347
METRIC RANK
85.1%
IN LABOR FORCE | AGE 30-34
94.3/ 100
METRIC RATING
117th/ 347
METRIC RANK
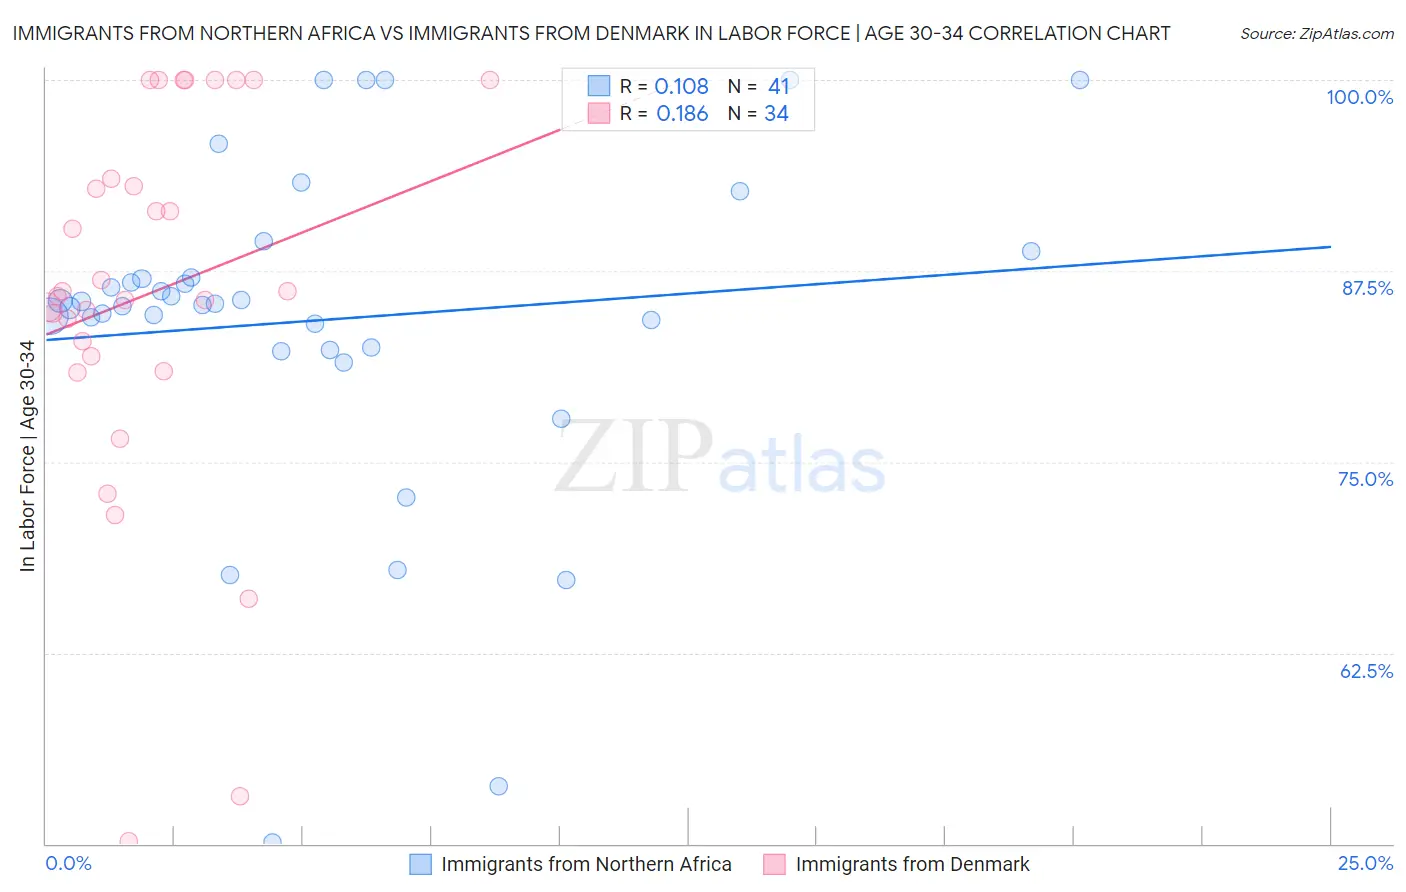
Immigrants from Northern Africa vs Immigrants from Denmark In Labor Force | Age 30-34 Correlation Chart
The statistical analysis conducted on geographies consisting of 321,096,130 people shows a poor positive correlation between the proportion of Immigrants from Northern Africa and labor force participation rate among population between the ages 30 and 34 in the United States with a correlation coefficient (R) of 0.108 and weighted average of 85.2%. Similarly, the statistical analysis conducted on geographies consisting of 136,406,477 people shows a poor positive correlation between the proportion of Immigrants from Denmark and labor force participation rate among population between the ages 30 and 34 in the United States with a correlation coefficient (R) of 0.186 and weighted average of 85.1%, a difference of 0.080%.
In Labor Force | Age 30-34 Correlation Summary
| Measurement | Immigrants from Northern Africa | Immigrants from Denmark |
| Minimum | 50.1% | 50.2% |
| Maximum | 100.0% | 100.0% |
| Range | 49.9% | 49.8% |
| Mean | 84.3% | 86.0% |
| Median | 85.3% | 86.0% |
| Interquartile 25% (IQ1) | 82.4% | 81.9% |
| Interquartile 75% (IQ3) | 88.0% | 93.5% |
| Interquartile Range (IQR) | 5.5% | 11.6% |
| Standard Deviation (Sample) | 10.9% | 12.5% |
| Standard Deviation (Population) | 10.8% | 12.3% |
Demographics Similar to Immigrants from Northern Africa and Immigrants from Denmark by In Labor Force | Age 30-34
In terms of in labor force | age 30-34, the demographic groups most similar to Immigrants from Northern Africa are Alsatian (85.2%, a difference of 0.0%), Immigrants from Middle Africa (85.2%, a difference of 0.0%), Ukrainian (85.2%, a difference of 0.010%), Immigrants from Ghana (85.2%, a difference of 0.010%), and Immigrants from Zimbabwe (85.1%, a difference of 0.020%). Similarly, the demographic groups most similar to Immigrants from Denmark are Immigrants from Malaysia (85.1%, a difference of 0.0%), Immigrants from Romania (85.1%, a difference of 0.010%), Yugoslavian (85.1%, a difference of 0.010%), Immigrants from South Central Asia (85.1%, a difference of 0.010%), and Egyptian (85.1%, a difference of 0.010%).
| Demographics | Rating | Rank | In Labor Force | Age 30-34 |
| Immigrants | Austria | 96.8 /100 | #102 | Exceptional 85.2% |
| Ukrainians | 96.6 /100 | #103 | Exceptional 85.2% |
| Immigrants | Ghana | 96.5 /100 | #104 | Exceptional 85.2% |
| Alsatians | 96.3 /100 | #105 | Exceptional 85.2% |
| Immigrants | Middle Africa | 96.3 /100 | #106 | Exceptional 85.2% |
| Immigrants | Northern Africa | 96.3 /100 | #107 | Exceptional 85.2% |
| Immigrants | Zimbabwe | 95.8 /100 | #108 | Exceptional 85.1% |
| Argentineans | 95.8 /100 | #109 | Exceptional 85.1% |
| Immigrants | South Africa | 95.3 /100 | #110 | Exceptional 85.1% |
| Immigrants | Scotland | 94.9 /100 | #111 | Exceptional 85.1% |
| Immigrants | Hungary | 94.8 /100 | #112 | Exceptional 85.1% |
| Immigrants | Romania | 94.7 /100 | #113 | Exceptional 85.1% |
| Yugoslavians | 94.7 /100 | #114 | Exceptional 85.1% |
| Immigrants | South Central Asia | 94.6 /100 | #115 | Exceptional 85.1% |
| Egyptians | 94.5 /100 | #116 | Exceptional 85.1% |
| Immigrants | Denmark | 94.3 /100 | #117 | Exceptional 85.1% |
| Immigrants | Malaysia | 94.2 /100 | #118 | Exceptional 85.1% |
| Asians | 93.4 /100 | #119 | Exceptional 85.1% |
| Immigrants | Southern Europe | 93.3 /100 | #120 | Exceptional 85.1% |
| Immigrants | Egypt | 93.2 /100 | #121 | Exceptional 85.1% |
| Immigrants | Kuwait | 92.6 /100 | #122 | Exceptional 85.1% |