Malaysian vs Immigrants from Kazakhstan In Labor Force | Age 20-24
COMPARE
Malaysian
Immigrants from Kazakhstan
In Labor Force | Age 20-24
In Labor Force | Age 20-24 Comparison
Malaysians
Immigrants from Kazakhstan
77.2%
IN LABOR FORCE | AGE 20-24
100.0/ 100
METRIC RATING
50th/ 347
METRIC RANK
73.8%
IN LABOR FORCE | AGE 20-24
1.1/ 100
METRIC RATING
252nd/ 347
METRIC RANK
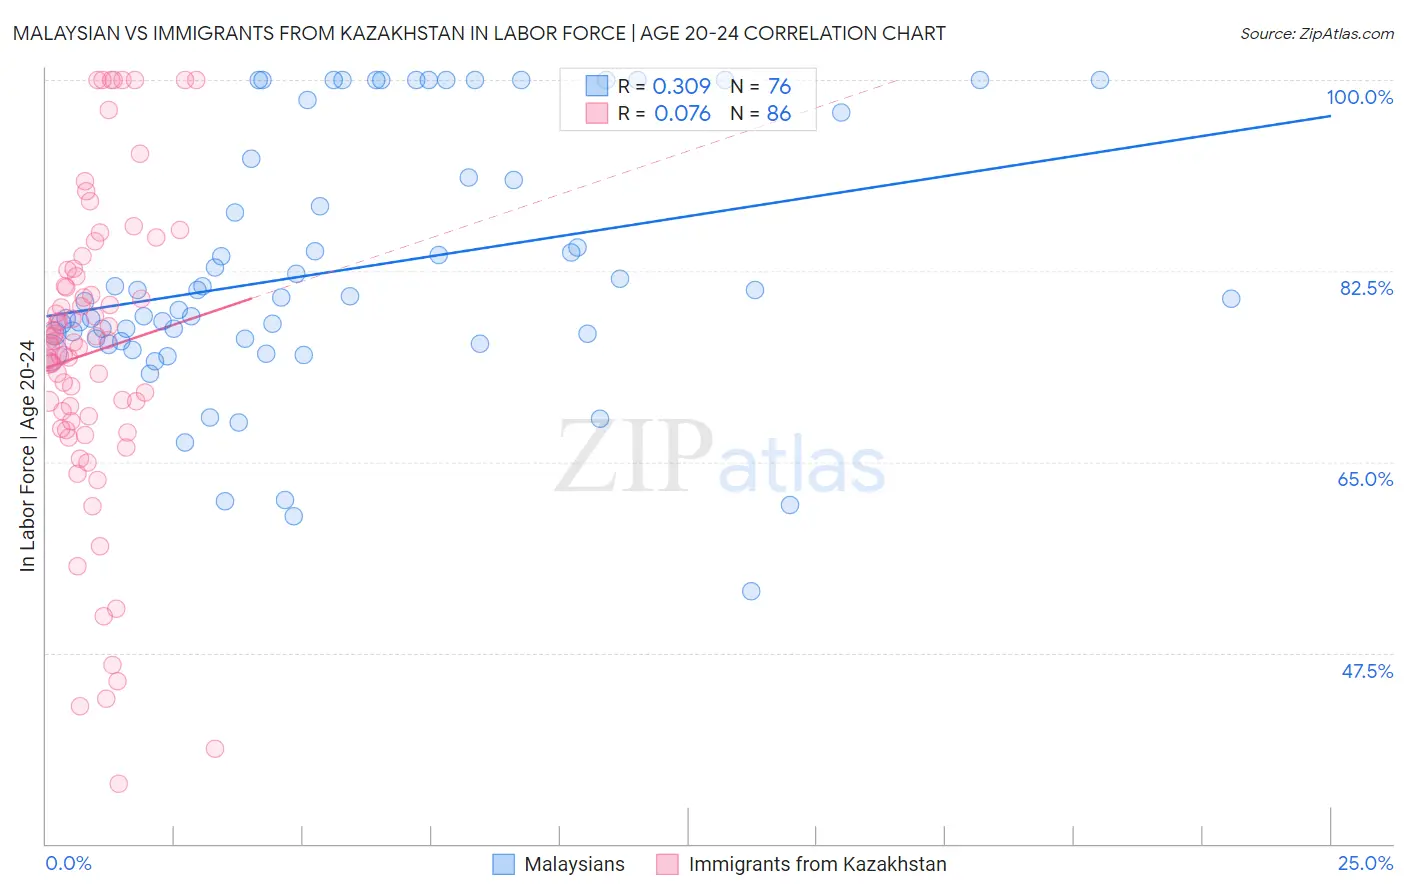
Malaysian vs Immigrants from Kazakhstan In Labor Force | Age 20-24 Correlation Chart
The statistical analysis conducted on geographies consisting of 226,070,224 people shows a mild positive correlation between the proportion of Malaysians and labor force participation rate among population between the ages 20 and 24 in the United States with a correlation coefficient (R) of 0.309 and weighted average of 77.2%. Similarly, the statistical analysis conducted on geographies consisting of 124,438,220 people shows a slight positive correlation between the proportion of Immigrants from Kazakhstan and labor force participation rate among population between the ages 20 and 24 in the United States with a correlation coefficient (R) of 0.076 and weighted average of 73.8%, a difference of 4.6%.
In Labor Force | Age 20-24 Correlation Summary
| Measurement | Malaysian | Immigrants from Kazakhstan |
| Minimum | 53.1% | 35.5% |
| Maximum | 100.0% | 100.0% |
| Range | 46.9% | 64.5% |
| Mean | 82.6% | 75.0% |
| Median | 80.0% | 76.0% |
| Interquartile 25% (IQ1) | 76.2% | 68.8% |
| Interquartile 75% (IQ3) | 92.0% | 82.0% |
| Interquartile Range (IQR) | 15.8% | 13.2% |
| Standard Deviation (Sample) | 11.7% | 14.3% |
| Standard Deviation (Population) | 11.6% | 14.2% |
Similar Demographics by In Labor Force | Age 20-24
Demographics Similar to Malaysians by In Labor Force | Age 20-24
In terms of in labor force | age 20-24, the demographic groups most similar to Malaysians are Croatian (77.2%, a difference of 0.010%), Indonesian (77.2%, a difference of 0.020%), Immigrants from the Azores (77.2%, a difference of 0.030%), Chinese (77.3%, a difference of 0.040%), and Serbian (77.3%, a difference of 0.050%).
| Demographics | Rating | Rank | In Labor Force | Age 20-24 |
| Immigrants | Laos | 100.0 /100 | #43 | Exceptional 77.4% |
| Fijians | 100.0 /100 | #44 | Exceptional 77.4% |
| Native Hawaiians | 100.0 /100 | #45 | Exceptional 77.4% |
| Samoans | 100.0 /100 | #46 | Exceptional 77.4% |
| Ethiopians | 100.0 /100 | #47 | Exceptional 77.3% |
| Serbians | 100.0 /100 | #48 | Exceptional 77.3% |
| Chinese | 100.0 /100 | #49 | Exceptional 77.3% |
| Malaysians | 100.0 /100 | #50 | Exceptional 77.2% |
| Croatians | 100.0 /100 | #51 | Exceptional 77.2% |
| Indonesians | 100.0 /100 | #52 | Exceptional 77.2% |
| Immigrants | Azores | 100.0 /100 | #53 | Exceptional 77.2% |
| Celtics | 99.9 /100 | #54 | Exceptional 77.1% |
| Immigrants | Liberia | 99.9 /100 | #55 | Exceptional 77.1% |
| Europeans | 99.9 /100 | #56 | Exceptional 77.1% |
| Chippewa | 99.9 /100 | #57 | Exceptional 77.1% |
Demographics Similar to Immigrants from Kazakhstan by In Labor Force | Age 20-24
In terms of in labor force | age 20-24, the demographic groups most similar to Immigrants from Kazakhstan are Immigrants from Egypt (73.8%, a difference of 0.020%), Black/African American (73.9%, a difference of 0.040%), Immigrants from Belgium (73.9%, a difference of 0.040%), Arapaho (73.8%, a difference of 0.040%), and Ute (73.8%, a difference of 0.050%).
| Demographics | Rating | Rank | In Labor Force | Age 20-24 |
| Turks | 1.8 /100 | #245 | Tragic 73.9% |
| Immigrants | Panama | 1.6 /100 | #246 | Tragic 73.9% |
| Colville | 1.5 /100 | #247 | Tragic 73.9% |
| Immigrants | Saudi Arabia | 1.5 /100 | #248 | Tragic 73.9% |
| Blacks/African Americans | 1.3 /100 | #249 | Tragic 73.9% |
| Immigrants | Belgium | 1.3 /100 | #250 | Tragic 73.9% |
| Immigrants | Egypt | 1.2 /100 | #251 | Tragic 73.8% |
| Immigrants | Kazakhstan | 1.1 /100 | #252 | Tragic 73.8% |
| Arapaho | 1.0 /100 | #253 | Tragic 73.8% |
| Ute | 1.0 /100 | #254 | Tragic 73.8% |
| Immigrants | Pakistan | 0.9 /100 | #255 | Tragic 73.8% |
| Spanish American Indians | 0.8 /100 | #256 | Tragic 73.7% |
| Paraguayans | 0.8 /100 | #257 | Tragic 73.7% |
| Egyptians | 0.7 /100 | #258 | Tragic 73.7% |
| Dutch West Indians | 0.7 /100 | #259 | Tragic 73.7% |