Immigrants from Lebanon vs Immigrants from Kazakhstan In Labor Force | Age 20-24
COMPARE
Immigrants from Lebanon
Immigrants from Kazakhstan
In Labor Force | Age 20-24
In Labor Force | Age 20-24 Comparison
Immigrants from Lebanon
Immigrants from Kazakhstan
73.1%
IN LABOR FORCE | AGE 20-24
0.1/ 100
METRIC RATING
286th/ 347
METRIC RANK
73.8%
IN LABOR FORCE | AGE 20-24
1.1/ 100
METRIC RATING
252nd/ 347
METRIC RANK
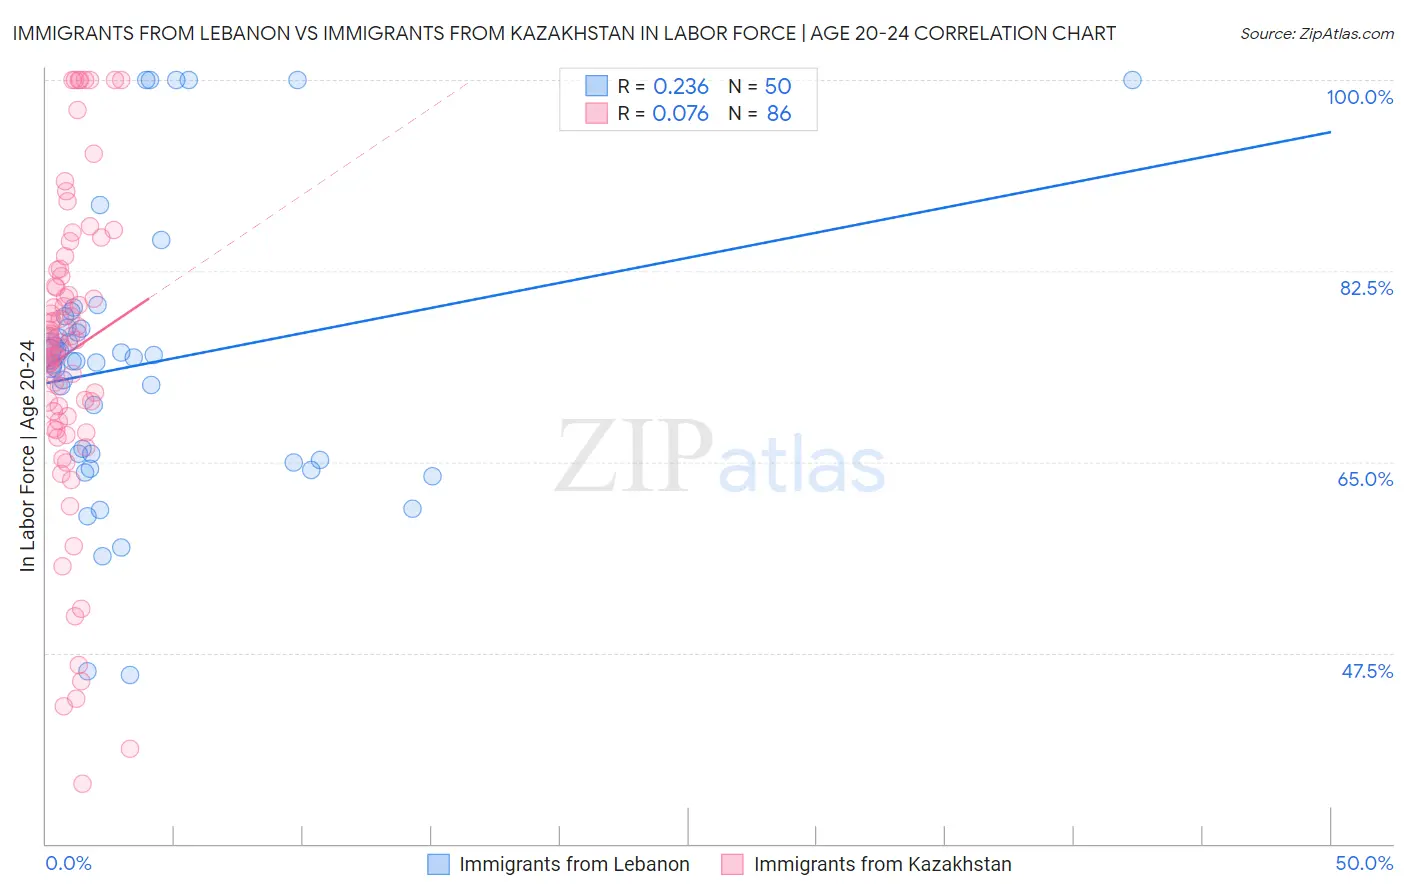
Immigrants from Lebanon vs Immigrants from Kazakhstan In Labor Force | Age 20-24 Correlation Chart
The statistical analysis conducted on geographies consisting of 217,133,124 people shows a weak positive correlation between the proportion of Immigrants from Lebanon and labor force participation rate among population between the ages 20 and 24 in the United States with a correlation coefficient (R) of 0.236 and weighted average of 73.1%. Similarly, the statistical analysis conducted on geographies consisting of 124,438,220 people shows a slight positive correlation between the proportion of Immigrants from Kazakhstan and labor force participation rate among population between the ages 20 and 24 in the United States with a correlation coefficient (R) of 0.076 and weighted average of 73.8%, a difference of 0.93%.
In Labor Force | Age 20-24 Correlation Summary
| Measurement | Immigrants from Lebanon | Immigrants from Kazakhstan |
| Minimum | 45.4% | 35.5% |
| Maximum | 100.0% | 100.0% |
| Range | 54.6% | 64.5% |
| Mean | 74.0% | 75.0% |
| Median | 74.2% | 76.0% |
| Interquartile 25% (IQ1) | 65.2% | 68.8% |
| Interquartile 75% (IQ3) | 77.3% | 82.0% |
| Interquartile Range (IQR) | 12.1% | 13.2% |
| Standard Deviation (Sample) | 12.8% | 14.3% |
| Standard Deviation (Population) | 12.7% | 14.2% |
Similar Demographics by In Labor Force | Age 20-24
Demographics Similar to Immigrants from Lebanon by In Labor Force | Age 20-24
In terms of in labor force | age 20-24, the demographic groups most similar to Immigrants from Lebanon are Immigrants from Korea (73.1%, a difference of 0.020%), Nicaraguan (73.2%, a difference of 0.030%), Kiowa (73.2%, a difference of 0.090%), Argentinean (73.1%, a difference of 0.10%), and Immigrants from Bahamas (73.2%, a difference of 0.11%).
| Demographics | Rating | Rank | In Labor Force | Age 20-24 |
| Venezuelans | 0.2 /100 | #279 | Tragic 73.3% |
| Bahamians | 0.1 /100 | #280 | Tragic 73.3% |
| Immigrants | Venezuela | 0.1 /100 | #281 | Tragic 73.2% |
| Immigrants | Spain | 0.1 /100 | #282 | Tragic 73.2% |
| Immigrants | Bahamas | 0.1 /100 | #283 | Tragic 73.2% |
| Kiowa | 0.1 /100 | #284 | Tragic 73.2% |
| Nicaraguans | 0.1 /100 | #285 | Tragic 73.2% |
| Immigrants | Lebanon | 0.1 /100 | #286 | Tragic 73.1% |
| Immigrants | Korea | 0.1 /100 | #287 | Tragic 73.1% |
| Argentineans | 0.1 /100 | #288 | Tragic 73.1% |
| U.S. Virgin Islanders | 0.1 /100 | #289 | Tragic 73.0% |
| Immigrants | Belarus | 0.1 /100 | #290 | Tragic 73.0% |
| Immigrants | Nicaragua | 0.0 /100 | #291 | Tragic 72.9% |
| Pueblo | 0.0 /100 | #292 | Tragic 72.9% |
| Immigrants | Belize | 0.0 /100 | #293 | Tragic 72.8% |
Demographics Similar to Immigrants from Kazakhstan by In Labor Force | Age 20-24
In terms of in labor force | age 20-24, the demographic groups most similar to Immigrants from Kazakhstan are Immigrants from Egypt (73.8%, a difference of 0.020%), Black/African American (73.9%, a difference of 0.040%), Immigrants from Belgium (73.9%, a difference of 0.040%), Arapaho (73.8%, a difference of 0.040%), and Ute (73.8%, a difference of 0.050%).
| Demographics | Rating | Rank | In Labor Force | Age 20-24 |
| Turks | 1.8 /100 | #245 | Tragic 73.9% |
| Immigrants | Panama | 1.6 /100 | #246 | Tragic 73.9% |
| Colville | 1.5 /100 | #247 | Tragic 73.9% |
| Immigrants | Saudi Arabia | 1.5 /100 | #248 | Tragic 73.9% |
| Blacks/African Americans | 1.3 /100 | #249 | Tragic 73.9% |
| Immigrants | Belgium | 1.3 /100 | #250 | Tragic 73.9% |
| Immigrants | Egypt | 1.2 /100 | #251 | Tragic 73.8% |
| Immigrants | Kazakhstan | 1.1 /100 | #252 | Tragic 73.8% |
| Arapaho | 1.0 /100 | #253 | Tragic 73.8% |
| Ute | 1.0 /100 | #254 | Tragic 73.8% |
| Immigrants | Pakistan | 0.9 /100 | #255 | Tragic 73.8% |
| Spanish American Indians | 0.8 /100 | #256 | Tragic 73.7% |
| Paraguayans | 0.8 /100 | #257 | Tragic 73.7% |
| Egyptians | 0.7 /100 | #258 | Tragic 73.7% |
| Dutch West Indians | 0.7 /100 | #259 | Tragic 73.7% |