Lumbee vs Italian In Labor Force | Age 20-24
COMPARE
Lumbee
Italian
In Labor Force | Age 20-24
In Labor Force | Age 20-24 Comparison
Lumbee
Italians
65.5%
IN LABOR FORCE | AGE 20-24
0.0/ 100
METRIC RATING
346th/ 347
METRIC RANK
76.5%
IN LABOR FORCE | AGE 20-24
99.6/ 100
METRIC RATING
80th/ 347
METRIC RANK
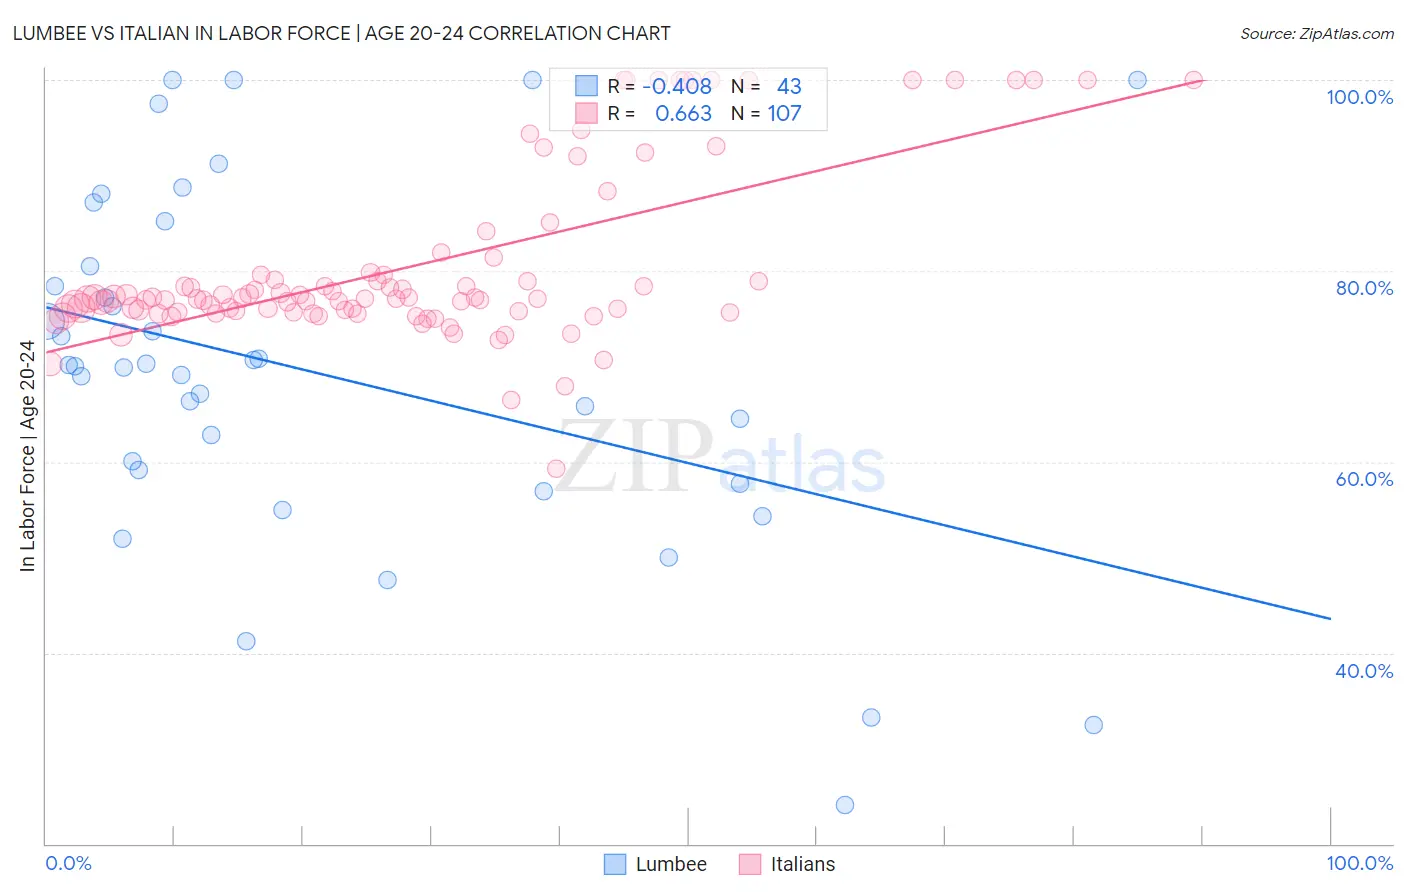
Lumbee vs Italian In Labor Force | Age 20-24 Correlation Chart
The statistical analysis conducted on geographies consisting of 92,285,947 people shows a moderate negative correlation between the proportion of Lumbee and labor force participation rate among population between the ages 20 and 24 in the United States with a correlation coefficient (R) of -0.408 and weighted average of 65.5%. Similarly, the statistical analysis conducted on geographies consisting of 573,427,196 people shows a significant positive correlation between the proportion of Italians and labor force participation rate among population between the ages 20 and 24 in the United States with a correlation coefficient (R) of 0.663 and weighted average of 76.5%, a difference of 16.8%.
In Labor Force | Age 20-24 Correlation Summary
| Measurement | Lumbee | Italian |
| Minimum | 24.0% | 59.3% |
| Maximum | 100.0% | 100.0% |
| Range | 76.0% | 40.7% |
| Mean | 69.3% | 80.5% |
| Median | 70.0% | 77.1% |
| Interquartile 25% (IQ1) | 57.7% | 75.7% |
| Interquartile 75% (IQ3) | 80.5% | 79.6% |
| Interquartile Range (IQR) | 22.8% | 3.9% |
| Standard Deviation (Sample) | 18.5% | 9.1% |
| Standard Deviation (Population) | 18.3% | 9.0% |
Similar Demographics by In Labor Force | Age 20-24
Demographics Similar to Lumbee by In Labor Force | Age 20-24
In terms of in labor force | age 20-24, the demographic groups most similar to Lumbee are Hopi (66.0%, a difference of 0.79%), Navajo (64.8%, a difference of 1.1%), Immigrants from Grenada (67.2%, a difference of 2.5%), Puerto Rican (68.3%, a difference of 4.3%), and Immigrants from St. Vincent and the Grenadines (68.4%, a difference of 4.4%).
| Demographics | Rating | Rank | In Labor Force | Age 20-24 |
| Yuman | 0.0 /100 | #333 | Tragic 70.3% |
| British West Indians | 0.0 /100 | #334 | Tragic 70.0% |
| Immigrants | Barbados | 0.0 /100 | #335 | Tragic 69.7% |
| Immigrants | Guyana | 0.0 /100 | #336 | Tragic 69.3% |
| Guyanese | 0.0 /100 | #337 | Tragic 69.2% |
| Pima | 0.0 /100 | #338 | Tragic 69.0% |
| Immigrants | Yemen | 0.0 /100 | #339 | Tragic 68.9% |
| Menominee | 0.0 /100 | #340 | Tragic 68.7% |
| Tohono O'odham | 0.0 /100 | #341 | Tragic 68.6% |
| Immigrants | St. Vincent and the Grenadines | 0.0 /100 | #342 | Tragic 68.4% |
| Puerto Ricans | 0.0 /100 | #343 | Tragic 68.3% |
| Immigrants | Grenada | 0.0 /100 | #344 | Tragic 67.2% |
| Hopi | 0.0 /100 | #345 | Tragic 66.0% |
| Lumbee | 0.0 /100 | #346 | Tragic 65.5% |
| Navajo | 0.0 /100 | #347 | Tragic 64.8% |
Demographics Similar to Italians by In Labor Force | Age 20-24
In terms of in labor force | age 20-24, the demographic groups most similar to Italians are Basque (76.5%, a difference of 0.020%), Hmong (76.5%, a difference of 0.020%), Immigrants from Zaire (76.6%, a difference of 0.030%), Immigrants from Cameroon (76.6%, a difference of 0.050%), and Canadian (76.6%, a difference of 0.050%).
| Demographics | Rating | Rank | In Labor Force | Age 20-24 |
| British | 99.8 /100 | #73 | Exceptional 76.7% |
| Cree | 99.7 /100 | #74 | Exceptional 76.6% |
| Immigrants | Middle Africa | 99.7 /100 | #75 | Exceptional 76.6% |
| Immigrants | Moldova | 99.6 /100 | #76 | Exceptional 76.6% |
| Immigrants | Cameroon | 99.6 /100 | #77 | Exceptional 76.6% |
| Canadians | 99.6 /100 | #78 | Exceptional 76.6% |
| Immigrants | Zaire | 99.6 /100 | #79 | Exceptional 76.6% |
| Italians | 99.6 /100 | #80 | Exceptional 76.5% |
| Basques | 99.5 /100 | #81 | Exceptional 76.5% |
| Hmong | 99.5 /100 | #82 | Exceptional 76.5% |
| Carpatho Rusyns | 99.4 /100 | #83 | Exceptional 76.5% |
| Austrians | 99.4 /100 | #84 | Exceptional 76.5% |
| Portuguese | 99.3 /100 | #85 | Exceptional 76.4% |
| Immigrants | Iraq | 99.3 /100 | #86 | Exceptional 76.4% |
| Immigrants | Thailand | 99.3 /100 | #87 | Exceptional 76.4% |