Barbadian vs Immigrants from Kazakhstan In Labor Force | Age 20-24
COMPARE
Barbadian
Immigrants from Kazakhstan
In Labor Force | Age 20-24
In Labor Force | Age 20-24 Comparison
Barbadians
Immigrants from Kazakhstan
71.1%
IN LABOR FORCE | AGE 20-24
0.0/ 100
METRIC RATING
325th/ 347
METRIC RANK
73.8%
IN LABOR FORCE | AGE 20-24
1.1/ 100
METRIC RATING
252nd/ 347
METRIC RANK
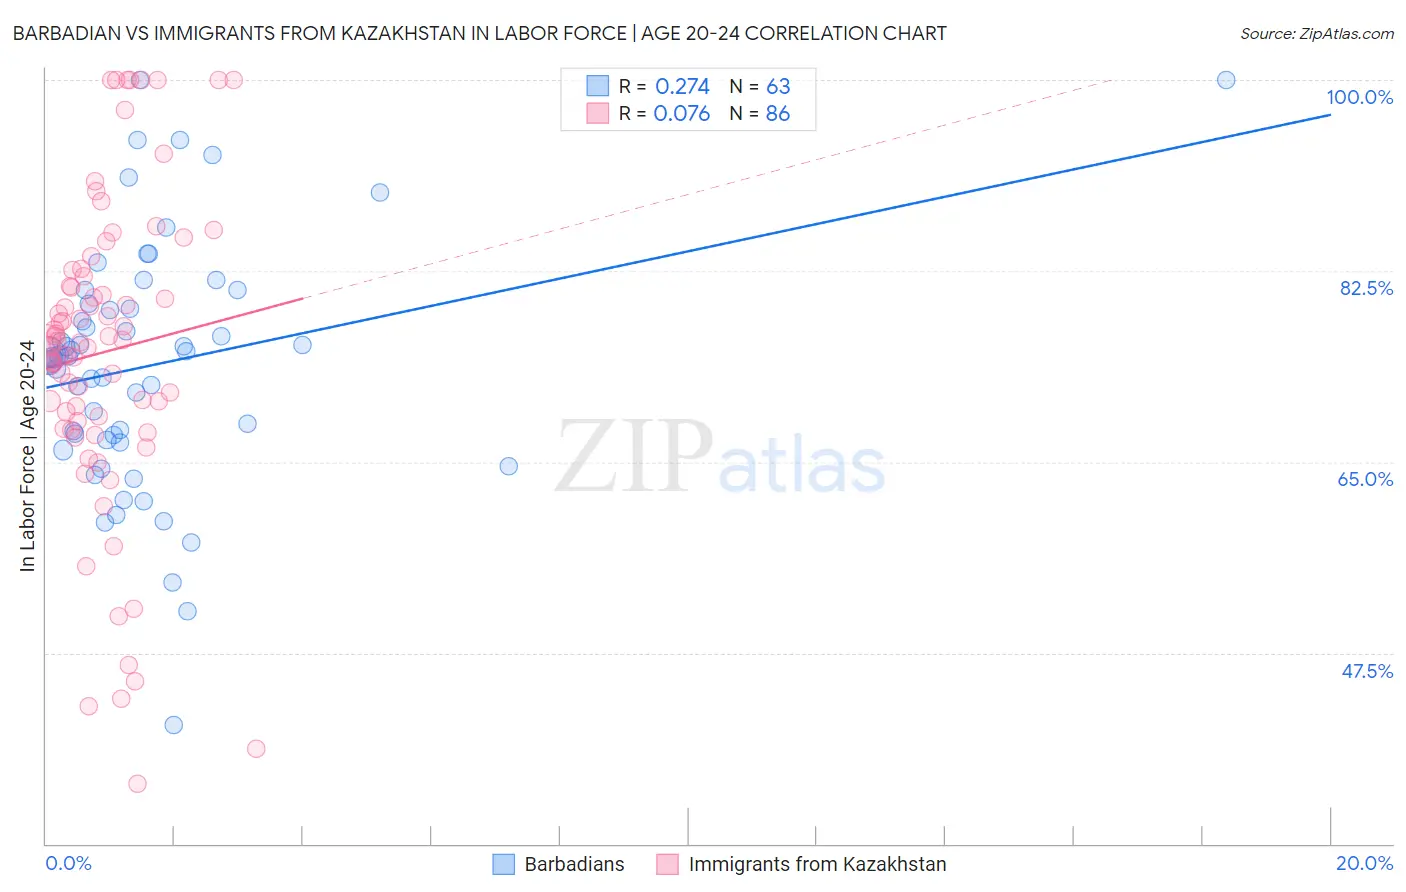
Barbadian vs Immigrants from Kazakhstan In Labor Force | Age 20-24 Correlation Chart
The statistical analysis conducted on geographies consisting of 141,301,120 people shows a weak positive correlation between the proportion of Barbadians and labor force participation rate among population between the ages 20 and 24 in the United States with a correlation coefficient (R) of 0.274 and weighted average of 71.1%. Similarly, the statistical analysis conducted on geographies consisting of 124,438,220 people shows a slight positive correlation between the proportion of Immigrants from Kazakhstan and labor force participation rate among population between the ages 20 and 24 in the United States with a correlation coefficient (R) of 0.076 and weighted average of 73.8%, a difference of 3.8%.
In Labor Force | Age 20-24 Correlation Summary
| Measurement | Barbadian | Immigrants from Kazakhstan |
| Minimum | 40.9% | 35.5% |
| Maximum | 100.0% | 100.0% |
| Range | 59.1% | 64.5% |
| Mean | 73.9% | 75.0% |
| Median | 74.7% | 76.0% |
| Interquartile 25% (IQ1) | 67.1% | 68.8% |
| Interquartile 75% (IQ3) | 79.5% | 82.0% |
| Interquartile Range (IQR) | 12.5% | 13.2% |
| Standard Deviation (Sample) | 11.3% | 14.3% |
| Standard Deviation (Population) | 11.2% | 14.2% |
Similar Demographics by In Labor Force | Age 20-24
Demographics Similar to Barbadians by In Labor Force | Age 20-24
In terms of in labor force | age 20-24, the demographic groups most similar to Barbadians are Dominican (71.1%, a difference of 0.080%), Immigrants from Trinidad and Tobago (71.1%, a difference of 0.090%), Immigrants from China (71.1%, a difference of 0.10%), Immigrants from Dominican Republic (71.2%, a difference of 0.11%), and West Indian (71.3%, a difference of 0.20%).
| Demographics | Rating | Rank | In Labor Force | Age 20-24 |
| Immigrants | Hong Kong | 0.0 /100 | #318 | Tragic 71.6% |
| Immigrants | Israel | 0.0 /100 | #319 | Tragic 71.6% |
| Trinidadians and Tobagonians | 0.0 /100 | #320 | Tragic 71.5% |
| Immigrants | Taiwan | 0.0 /100 | #321 | Tragic 71.5% |
| Filipinos | 0.0 /100 | #322 | Tragic 71.4% |
| West Indians | 0.0 /100 | #323 | Tragic 71.3% |
| Immigrants | Dominican Republic | 0.0 /100 | #324 | Tragic 71.2% |
| Barbadians | 0.0 /100 | #325 | Tragic 71.1% |
| Dominicans | 0.0 /100 | #326 | Tragic 71.1% |
| Immigrants | Trinidad and Tobago | 0.0 /100 | #327 | Tragic 71.1% |
| Immigrants | China | 0.0 /100 | #328 | Tragic 71.1% |
| Yup'ik | 0.0 /100 | #329 | Tragic 70.9% |
| Vietnamese | 0.0 /100 | #330 | Tragic 70.6% |
| Immigrants | Bangladesh | 0.0 /100 | #331 | Tragic 70.6% |
| Immigrants | Uzbekistan | 0.0 /100 | #332 | Tragic 70.4% |
Demographics Similar to Immigrants from Kazakhstan by In Labor Force | Age 20-24
In terms of in labor force | age 20-24, the demographic groups most similar to Immigrants from Kazakhstan are Immigrants from Egypt (73.8%, a difference of 0.020%), Black/African American (73.9%, a difference of 0.040%), Immigrants from Belgium (73.9%, a difference of 0.040%), Arapaho (73.8%, a difference of 0.040%), and Ute (73.8%, a difference of 0.050%).
| Demographics | Rating | Rank | In Labor Force | Age 20-24 |
| Turks | 1.8 /100 | #245 | Tragic 73.9% |
| Immigrants | Panama | 1.6 /100 | #246 | Tragic 73.9% |
| Colville | 1.5 /100 | #247 | Tragic 73.9% |
| Immigrants | Saudi Arabia | 1.5 /100 | #248 | Tragic 73.9% |
| Blacks/African Americans | 1.3 /100 | #249 | Tragic 73.9% |
| Immigrants | Belgium | 1.3 /100 | #250 | Tragic 73.9% |
| Immigrants | Egypt | 1.2 /100 | #251 | Tragic 73.8% |
| Immigrants | Kazakhstan | 1.1 /100 | #252 | Tragic 73.8% |
| Arapaho | 1.0 /100 | #253 | Tragic 73.8% |
| Ute | 1.0 /100 | #254 | Tragic 73.8% |
| Immigrants | Pakistan | 0.9 /100 | #255 | Tragic 73.8% |
| Spanish American Indians | 0.8 /100 | #256 | Tragic 73.7% |
| Paraguayans | 0.8 /100 | #257 | Tragic 73.7% |
| Egyptians | 0.7 /100 | #258 | Tragic 73.7% |
| Dutch West Indians | 0.7 /100 | #259 | Tragic 73.7% |