Lumbee vs Immigrants from Denmark In Labor Force | Age 20-24
COMPARE
Lumbee
Immigrants from Denmark
In Labor Force | Age 20-24
In Labor Force | Age 20-24 Comparison
Lumbee
Immigrants from Denmark
65.5%
IN LABOR FORCE | AGE 20-24
0.0/ 100
METRIC RATING
346th/ 347
METRIC RANK
74.8%
IN LABOR FORCE | AGE 20-24
25.8/ 100
METRIC RATING
194th/ 347
METRIC RANK
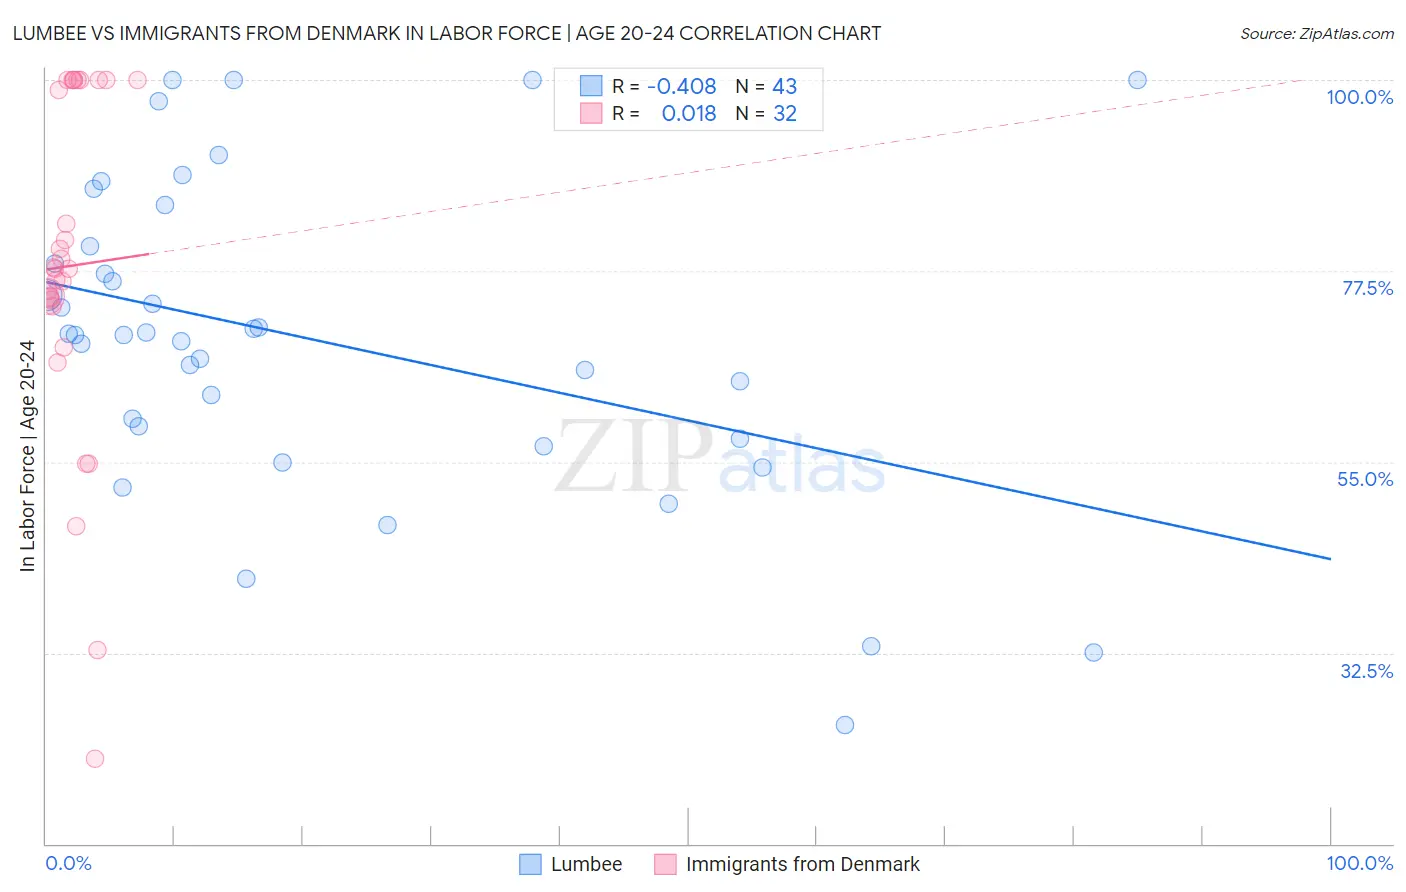
Lumbee vs Immigrants from Denmark In Labor Force | Age 20-24 Correlation Chart
The statistical analysis conducted on geographies consisting of 92,285,947 people shows a moderate negative correlation between the proportion of Lumbee and labor force participation rate among population between the ages 20 and 24 in the United States with a correlation coefficient (R) of -0.408 and weighted average of 65.5%. Similarly, the statistical analysis conducted on geographies consisting of 136,401,284 people shows no correlation between the proportion of Immigrants from Denmark and labor force participation rate among population between the ages 20 and 24 in the United States with a correlation coefficient (R) of 0.018 and weighted average of 74.8%, a difference of 14.1%.
In Labor Force | Age 20-24 Correlation Summary
| Measurement | Lumbee | Immigrants from Denmark |
| Minimum | 24.0% | 20.0% |
| Maximum | 100.0% | 100.0% |
| Range | 76.0% | 80.0% |
| Mean | 69.3% | 78.1% |
| Median | 70.0% | 77.7% |
| Interquartile 25% (IQ1) | 57.7% | 73.7% |
| Interquartile 75% (IQ3) | 80.5% | 100.0% |
| Interquartile Range (IQR) | 22.8% | 26.3% |
| Standard Deviation (Sample) | 18.5% | 20.1% |
| Standard Deviation (Population) | 18.3% | 19.8% |
Similar Demographics by In Labor Force | Age 20-24
Demographics Similar to Lumbee by In Labor Force | Age 20-24
In terms of in labor force | age 20-24, the demographic groups most similar to Lumbee are Hopi (66.0%, a difference of 0.79%), Navajo (64.8%, a difference of 1.1%), Immigrants from Grenada (67.2%, a difference of 2.5%), Puerto Rican (68.3%, a difference of 4.3%), and Immigrants from St. Vincent and the Grenadines (68.4%, a difference of 4.4%).
| Demographics | Rating | Rank | In Labor Force | Age 20-24 |
| Yuman | 0.0 /100 | #333 | Tragic 70.3% |
| British West Indians | 0.0 /100 | #334 | Tragic 70.0% |
| Immigrants | Barbados | 0.0 /100 | #335 | Tragic 69.7% |
| Immigrants | Guyana | 0.0 /100 | #336 | Tragic 69.3% |
| Guyanese | 0.0 /100 | #337 | Tragic 69.2% |
| Pima | 0.0 /100 | #338 | Tragic 69.0% |
| Immigrants | Yemen | 0.0 /100 | #339 | Tragic 68.9% |
| Menominee | 0.0 /100 | #340 | Tragic 68.7% |
| Tohono O'odham | 0.0 /100 | #341 | Tragic 68.6% |
| Immigrants | St. Vincent and the Grenadines | 0.0 /100 | #342 | Tragic 68.4% |
| Puerto Ricans | 0.0 /100 | #343 | Tragic 68.3% |
| Immigrants | Grenada | 0.0 /100 | #344 | Tragic 67.2% |
| Hopi | 0.0 /100 | #345 | Tragic 66.0% |
| Lumbee | 0.0 /100 | #346 | Tragic 65.5% |
| Navajo | 0.0 /100 | #347 | Tragic 64.8% |
Demographics Similar to Immigrants from Denmark by In Labor Force | Age 20-24
In terms of in labor force | age 20-24, the demographic groups most similar to Immigrants from Denmark are Eastern European (74.8%, a difference of 0.010%), Immigrants from Vietnam (74.7%, a difference of 0.010%), Panamanian (74.7%, a difference of 0.010%), Immigrants from Europe (74.8%, a difference of 0.030%), and Alsatian (74.8%, a difference of 0.030%).
| Demographics | Rating | Rank | In Labor Force | Age 20-24 |
| Immigrants | Honduras | 33.5 /100 | #187 | Fair 74.9% |
| Hondurans | 32.7 /100 | #188 | Fair 74.8% |
| Immigrants | Northern Europe | 32.6 /100 | #189 | Fair 74.8% |
| Russians | 32.2 /100 | #190 | Fair 74.8% |
| Senegalese | 28.1 /100 | #191 | Fair 74.8% |
| Immigrants | Europe | 27.5 /100 | #192 | Fair 74.8% |
| Alsatians | 27.1 /100 | #193 | Fair 74.8% |
| Immigrants | Denmark | 25.8 /100 | #194 | Fair 74.8% |
| Eastern Europeans | 25.4 /100 | #195 | Fair 74.8% |
| Immigrants | Vietnam | 25.1 /100 | #196 | Fair 74.7% |
| Panamanians | 25.0 /100 | #197 | Fair 74.7% |
| Immigrants | Nigeria | 24.2 /100 | #198 | Fair 74.7% |
| Taiwanese | 23.2 /100 | #199 | Fair 74.7% |
| Nigerians | 21.9 /100 | #200 | Fair 74.7% |
| Choctaw | 21.4 /100 | #201 | Fair 74.7% |