Immigrants from Sudan vs Immigrants from Kazakhstan In Labor Force | Age 20-24
COMPARE
Immigrants from Sudan
Immigrants from Kazakhstan
In Labor Force | Age 20-24
In Labor Force | Age 20-24 Comparison
Immigrants from Sudan
Immigrants from Kazakhstan
76.8%
IN LABOR FORCE | AGE 20-24
99.8/ 100
METRIC RATING
69th/ 347
METRIC RANK
73.8%
IN LABOR FORCE | AGE 20-24
1.1/ 100
METRIC RATING
252nd/ 347
METRIC RANK
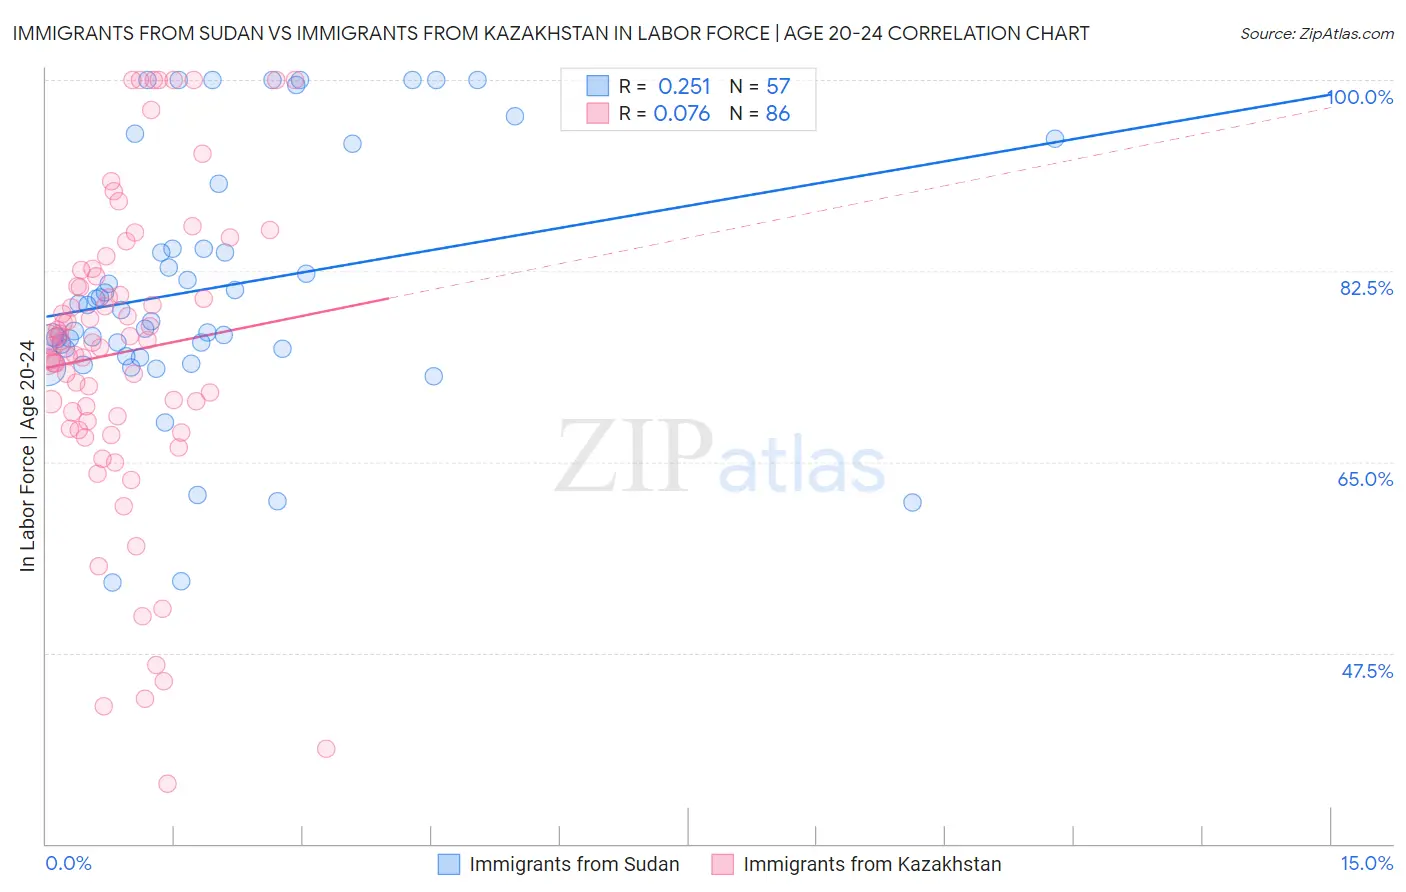
Immigrants from Sudan vs Immigrants from Kazakhstan In Labor Force | Age 20-24 Correlation Chart
The statistical analysis conducted on geographies consisting of 118,956,424 people shows a weak positive correlation between the proportion of Immigrants from Sudan and labor force participation rate among population between the ages 20 and 24 in the United States with a correlation coefficient (R) of 0.251 and weighted average of 76.8%. Similarly, the statistical analysis conducted on geographies consisting of 124,438,220 people shows a slight positive correlation between the proportion of Immigrants from Kazakhstan and labor force participation rate among population between the ages 20 and 24 in the United States with a correlation coefficient (R) of 0.076 and weighted average of 73.8%, a difference of 4.1%.
In Labor Force | Age 20-24 Correlation Summary
| Measurement | Immigrants from Sudan | Immigrants from Kazakhstan |
| Minimum | 54.0% | 35.5% |
| Maximum | 100.0% | 100.0% |
| Range | 46.0% | 64.5% |
| Mean | 81.0% | 75.0% |
| Median | 78.9% | 76.0% |
| Interquartile 25% (IQ1) | 75.0% | 68.8% |
| Interquartile 75% (IQ3) | 87.5% | 82.0% |
| Interquartile Range (IQR) | 12.5% | 13.2% |
| Standard Deviation (Sample) | 11.7% | 14.3% |
| Standard Deviation (Population) | 11.6% | 14.2% |
Similar Demographics by In Labor Force | Age 20-24
Demographics Similar to Immigrants from Sudan by In Labor Force | Age 20-24
In terms of in labor force | age 20-24, the demographic groups most similar to Immigrants from Sudan are Ottawa (76.8%, a difference of 0.010%), French American Indian (76.8%, a difference of 0.020%), Slavic (76.9%, a difference of 0.050%), Icelander (76.9%, a difference of 0.060%), and Crow (76.9%, a difference of 0.080%).
| Demographics | Rating | Rank | In Labor Force | Age 20-24 |
| Immigrants | Kenya | 99.9 /100 | #62 | Exceptional 77.0% |
| Lithuanians | 99.9 /100 | #63 | Exceptional 77.0% |
| Whites/Caucasians | 99.9 /100 | #64 | Exceptional 76.9% |
| Crow | 99.9 /100 | #65 | Exceptional 76.9% |
| Icelanders | 99.9 /100 | #66 | Exceptional 76.9% |
| Slavs | 99.9 /100 | #67 | Exceptional 76.9% |
| French American Indians | 99.8 /100 | #68 | Exceptional 76.8% |
| Immigrants | Sudan | 99.8 /100 | #69 | Exceptional 76.8% |
| Ottawa | 99.8 /100 | #70 | Exceptional 76.8% |
| Northern Europeans | 99.8 /100 | #71 | Exceptional 76.8% |
| Guamanians/Chamorros | 99.8 /100 | #72 | Exceptional 76.7% |
| British | 99.8 /100 | #73 | Exceptional 76.7% |
| Cree | 99.7 /100 | #74 | Exceptional 76.6% |
| Immigrants | Middle Africa | 99.7 /100 | #75 | Exceptional 76.6% |
| Immigrants | Moldova | 99.6 /100 | #76 | Exceptional 76.6% |
Demographics Similar to Immigrants from Kazakhstan by In Labor Force | Age 20-24
In terms of in labor force | age 20-24, the demographic groups most similar to Immigrants from Kazakhstan are Immigrants from Egypt (73.8%, a difference of 0.020%), Black/African American (73.9%, a difference of 0.040%), Immigrants from Belgium (73.9%, a difference of 0.040%), Arapaho (73.8%, a difference of 0.040%), and Ute (73.8%, a difference of 0.050%).
| Demographics | Rating | Rank | In Labor Force | Age 20-24 |
| Turks | 1.8 /100 | #245 | Tragic 73.9% |
| Immigrants | Panama | 1.6 /100 | #246 | Tragic 73.9% |
| Colville | 1.5 /100 | #247 | Tragic 73.9% |
| Immigrants | Saudi Arabia | 1.5 /100 | #248 | Tragic 73.9% |
| Blacks/African Americans | 1.3 /100 | #249 | Tragic 73.9% |
| Immigrants | Belgium | 1.3 /100 | #250 | Tragic 73.9% |
| Immigrants | Egypt | 1.2 /100 | #251 | Tragic 73.8% |
| Immigrants | Kazakhstan | 1.1 /100 | #252 | Tragic 73.8% |
| Arapaho | 1.0 /100 | #253 | Tragic 73.8% |
| Ute | 1.0 /100 | #254 | Tragic 73.8% |
| Immigrants | Pakistan | 0.9 /100 | #255 | Tragic 73.8% |
| Spanish American Indians | 0.8 /100 | #256 | Tragic 73.7% |
| Paraguayans | 0.8 /100 | #257 | Tragic 73.7% |
| Egyptians | 0.7 /100 | #258 | Tragic 73.7% |
| Dutch West Indians | 0.7 /100 | #259 | Tragic 73.7% |