Lumbee vs Immigrants from Senegal In Labor Force | Age 16-19
COMPARE
Lumbee
Immigrants from Senegal
In Labor Force | Age 16-19
In Labor Force | Age 16-19 Comparison
Lumbee
Immigrants from Senegal
31.0%
IN LABOR FORCE | AGE 16-19
0.0/ 100
METRIC RATING
330th/ 347
METRIC RANK
35.3%
IN LABOR FORCE | AGE 16-19
5.5/ 100
METRIC RATING
228th/ 347
METRIC RANK
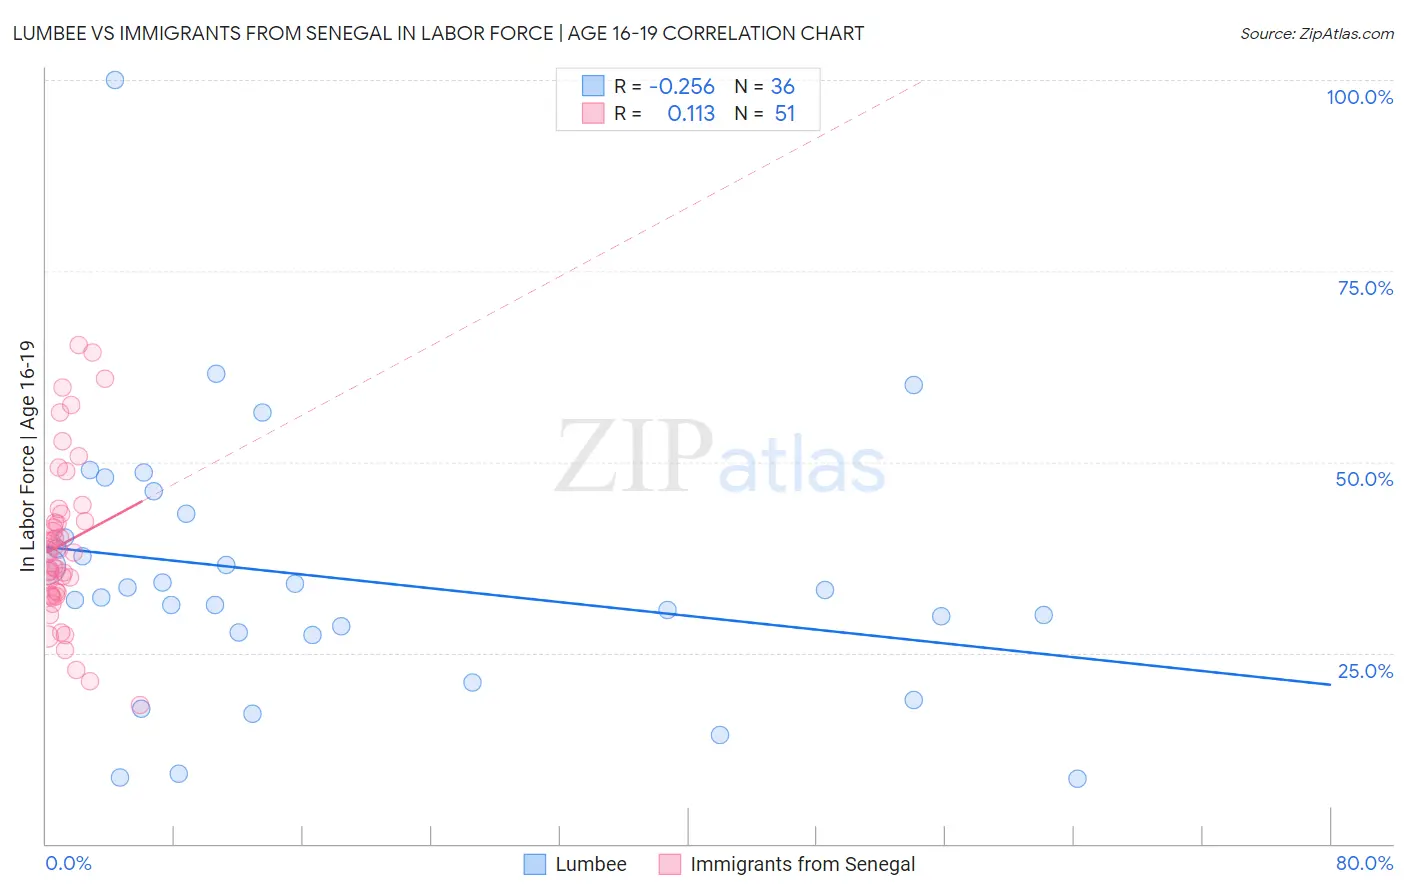
Lumbee vs Immigrants from Senegal In Labor Force | Age 16-19 Correlation Chart
The statistical analysis conducted on geographies consisting of 92,241,195 people shows a weak negative correlation between the proportion of Lumbee and labor force participation rate among population between the ages 16 and 19 in the United States with a correlation coefficient (R) of -0.256 and weighted average of 31.0%. Similarly, the statistical analysis conducted on geographies consisting of 90,105,312 people shows a poor positive correlation between the proportion of Immigrants from Senegal and labor force participation rate among population between the ages 16 and 19 in the United States with a correlation coefficient (R) of 0.113 and weighted average of 35.3%, a difference of 13.9%.
In Labor Force | Age 16-19 Correlation Summary
| Measurement | Lumbee | Immigrants from Senegal |
| Minimum | 8.5% | 18.2% |
| Maximum | 100.0% | 65.3% |
| Range | 91.5% | 47.1% |
| Mean | 34.8% | 39.3% |
| Median | 32.7% | 38.2% |
| Interquartile 25% (IQ1) | 27.5% | 32.6% |
| Interquartile 75% (IQ3) | 41.7% | 43.1% |
| Interquartile Range (IQR) | 14.2% | 10.5% |
| Standard Deviation (Sample) | 17.4% | 10.6% |
| Standard Deviation (Population) | 17.2% | 10.5% |
Similar Demographics by In Labor Force | Age 16-19
Demographics Similar to Lumbee by In Labor Force | Age 16-19
In terms of in labor force | age 16-19, the demographic groups most similar to Lumbee are Barbadian (31.0%, a difference of 0.12%), Immigrants from Ecuador (31.0%, a difference of 0.15%), Trinidadian and Tobagonian (30.9%, a difference of 0.15%), Immigrants from Taiwan (31.0%, a difference of 0.19%), and Immigrants from Dominican Republic (31.1%, a difference of 0.35%).
| Demographics | Rating | Rank | In Labor Force | Age 16-19 |
| Immigrants | Caribbean | 0.0 /100 | #323 | Tragic 31.2% |
| Dominicans | 0.0 /100 | #324 | Tragic 31.2% |
| Immigrants | China | 0.0 /100 | #325 | Tragic 31.1% |
| Immigrants | Dominican Republic | 0.0 /100 | #326 | Tragic 31.1% |
| Immigrants | Taiwan | 0.0 /100 | #327 | Tragic 31.0% |
| Immigrants | Ecuador | 0.0 /100 | #328 | Tragic 31.0% |
| Barbadians | 0.0 /100 | #329 | Tragic 31.0% |
| Lumbee | 0.0 /100 | #330 | Tragic 31.0% |
| Trinidadians and Tobagonians | 0.0 /100 | #331 | Tragic 30.9% |
| Immigrants | Israel | 0.0 /100 | #332 | Tragic 30.5% |
| Immigrants | Hong Kong | 0.0 /100 | #333 | Tragic 30.5% |
| Puerto Ricans | 0.0 /100 | #334 | Tragic 30.3% |
| Immigrants | Cuba | 0.0 /100 | #335 | Tragic 30.2% |
| Immigrants | Trinidad and Tobago | 0.0 /100 | #336 | Tragic 30.2% |
| Immigrants | Bangladesh | 0.0 /100 | #337 | Tragic 30.0% |
Demographics Similar to Immigrants from Senegal by In Labor Force | Age 16-19
In terms of in labor force | age 16-19, the demographic groups most similar to Immigrants from Senegal are Mongolian (35.3%, a difference of 0.050%), Immigrants from Guatemala (35.3%, a difference of 0.060%), Immigrants from Lebanon (35.2%, a difference of 0.13%), Immigrants from Belgium (35.3%, a difference of 0.15%), and Immigrants from Honduras (35.2%, a difference of 0.16%).
| Demographics | Rating | Rank | In Labor Force | Age 16-19 |
| Turks | 7.3 /100 | #221 | Tragic 35.4% |
| Immigrants | Ghana | 7.3 /100 | #222 | Tragic 35.4% |
| Ghanaians | 6.5 /100 | #223 | Tragic 35.3% |
| Hondurans | 6.5 /100 | #224 | Tragic 35.3% |
| Immigrants | Belgium | 6.1 /100 | #225 | Tragic 35.3% |
| Immigrants | Guatemala | 5.7 /100 | #226 | Tragic 35.3% |
| Mongolians | 5.7 /100 | #227 | Tragic 35.3% |
| Immigrants | Senegal | 5.5 /100 | #228 | Tragic 35.3% |
| Immigrants | Lebanon | 5.0 /100 | #229 | Tragic 35.2% |
| Immigrants | Honduras | 4.9 /100 | #230 | Tragic 35.2% |
| Immigrants | Syria | 4.5 /100 | #231 | Tragic 35.2% |
| Immigrants | Kazakhstan | 4.5 /100 | #232 | Tragic 35.2% |
| Immigrants | France | 4.3 /100 | #233 | Tragic 35.1% |
| Immigrants | Mexico | 4.2 /100 | #234 | Tragic 35.1% |
| Immigrants | Philippines | 4.0 /100 | #235 | Tragic 35.1% |