Immigrants from Egypt vs Immigrants from Haiti In Labor Force | Age 16-19
COMPARE
Immigrants from Egypt
Immigrants from Haiti
In Labor Force | Age 16-19
In Labor Force | Age 16-19 Comparison
Immigrants from Egypt
Immigrants from Haiti
34.6%
IN LABOR FORCE | AGE 16-19
1.2/ 100
METRIC RATING
257th/ 347
METRIC RANK
33.2%
IN LABOR FORCE | AGE 16-19
0.1/ 100
METRIC RATING
297th/ 347
METRIC RANK
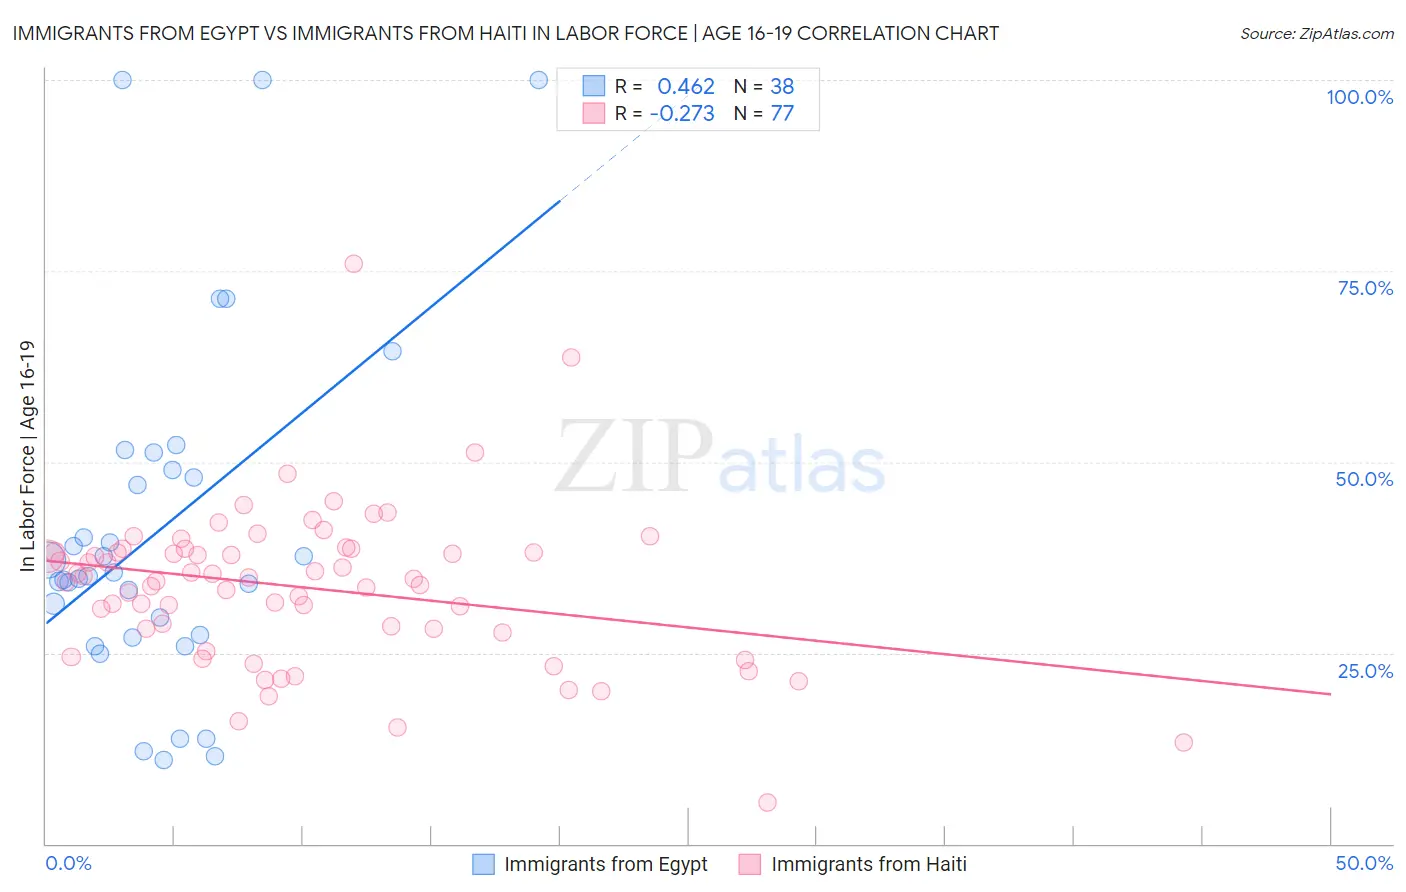
Immigrants from Egypt vs Immigrants from Haiti In Labor Force | Age 16-19 Correlation Chart
The statistical analysis conducted on geographies consisting of 245,278,440 people shows a moderate positive correlation between the proportion of Immigrants from Egypt and labor force participation rate among population between the ages 16 and 19 in the United States with a correlation coefficient (R) of 0.462 and weighted average of 34.6%. Similarly, the statistical analysis conducted on geographies consisting of 225,034,404 people shows a weak negative correlation between the proportion of Immigrants from Haiti and labor force participation rate among population between the ages 16 and 19 in the United States with a correlation coefficient (R) of -0.273 and weighted average of 33.2%, a difference of 4.1%.
In Labor Force | Age 16-19 Correlation Summary
| Measurement | Immigrants from Egypt | Immigrants from Haiti |
| Minimum | 11.0% | 5.3% |
| Maximum | 100.0% | 76.0% |
| Range | 89.0% | 70.7% |
| Mean | 41.2% | 33.5% |
| Median | 35.3% | 34.6% |
| Interquartile 25% (IQ1) | 27.4% | 27.9% |
| Interquartile 75% (IQ3) | 48.9% | 38.3% |
| Interquartile Range (IQR) | 21.5% | 10.5% |
| Standard Deviation (Sample) | 22.7% | 10.4% |
| Standard Deviation (Population) | 22.4% | 10.3% |
Similar Demographics by In Labor Force | Age 16-19
Demographics Similar to Immigrants from Egypt by In Labor Force | Age 16-19
In terms of in labor force | age 16-19, the demographic groups most similar to Immigrants from Egypt are Immigrants from South Central Asia (34.6%, a difference of 0.010%), Thai (34.6%, a difference of 0.010%), Immigrants (34.6%, a difference of 0.020%), Egyptian (34.5%, a difference of 0.10%), and Peruvian (34.6%, a difference of 0.11%).
| Demographics | Rating | Rank | In Labor Force | Age 16-19 |
| Immigrants | Pakistan | 2.0 /100 | #250 | Tragic 34.8% |
| Immigrants | Western Asia | 2.0 /100 | #251 | Tragic 34.8% |
| Immigrants | Chile | 2.0 /100 | #252 | Tragic 34.8% |
| Immigrants | Japan | 1.5 /100 | #253 | Tragic 34.7% |
| Bahamians | 1.4 /100 | #254 | Tragic 34.6% |
| Peruvians | 1.4 /100 | #255 | Tragic 34.6% |
| Immigrants | South Central Asia | 1.3 /100 | #256 | Tragic 34.6% |
| Immigrants | Egypt | 1.2 /100 | #257 | Tragic 34.6% |
| Thais | 1.2 /100 | #258 | Tragic 34.6% |
| Immigrants | Immigrants | 1.2 /100 | #259 | Tragic 34.6% |
| Egyptians | 1.2 /100 | #260 | Tragic 34.5% |
| Salvadorans | 1.1 /100 | #261 | Tragic 34.5% |
| Hispanics or Latinos | 1.1 /100 | #262 | Tragic 34.5% |
| Burmese | 1.1 /100 | #263 | Tragic 34.5% |
| Immigrants | Uruguay | 0.9 /100 | #264 | Tragic 34.4% |
Demographics Similar to Immigrants from Haiti by In Labor Force | Age 16-19
In terms of in labor force | age 16-19, the demographic groups most similar to Immigrants from Haiti are Jamaican (33.2%, a difference of 0.090%), Yup'ik (33.3%, a difference of 0.22%), Argentinean (33.3%, a difference of 0.33%), Immigrants from South America (33.3%, a difference of 0.34%), and Iranian (33.0%, a difference of 0.51%).
| Demographics | Rating | Rank | In Labor Force | Age 16-19 |
| Immigrants | Colombia | 0.1 /100 | #290 | Tragic 33.5% |
| Immigrants | Belarus | 0.1 /100 | #291 | Tragic 33.4% |
| Haitians | 0.1 /100 | #292 | Tragic 33.4% |
| Immigrants | South America | 0.1 /100 | #293 | Tragic 33.3% |
| Argentineans | 0.1 /100 | #294 | Tragic 33.3% |
| Yup'ik | 0.1 /100 | #295 | Tragic 33.3% |
| Jamaicans | 0.1 /100 | #296 | Tragic 33.2% |
| Immigrants | Haiti | 0.1 /100 | #297 | Tragic 33.2% |
| Iranians | 0.0 /100 | #298 | Tragic 33.0% |
| Armenians | 0.0 /100 | #299 | Tragic 32.9% |
| Immigrants | Argentina | 0.0 /100 | #300 | Tragic 32.9% |
| Okinawans | 0.0 /100 | #301 | Tragic 32.8% |
| Belizeans | 0.0 /100 | #302 | Tragic 32.8% |
| Immigrants | Dominica | 0.0 /100 | #303 | Tragic 32.5% |
| Israelis | 0.0 /100 | #304 | Tragic 32.4% |