Lumbee vs Immigrants from Hungary In Labor Force | Age 16-19
COMPARE
Lumbee
Immigrants from Hungary
In Labor Force | Age 16-19
In Labor Force | Age 16-19 Comparison
Lumbee
Immigrants from Hungary
31.0%
IN LABOR FORCE | AGE 16-19
0.0/ 100
METRIC RATING
330th/ 347
METRIC RANK
36.2%
IN LABOR FORCE | AGE 16-19
28.8/ 100
METRIC RATING
189th/ 347
METRIC RANK
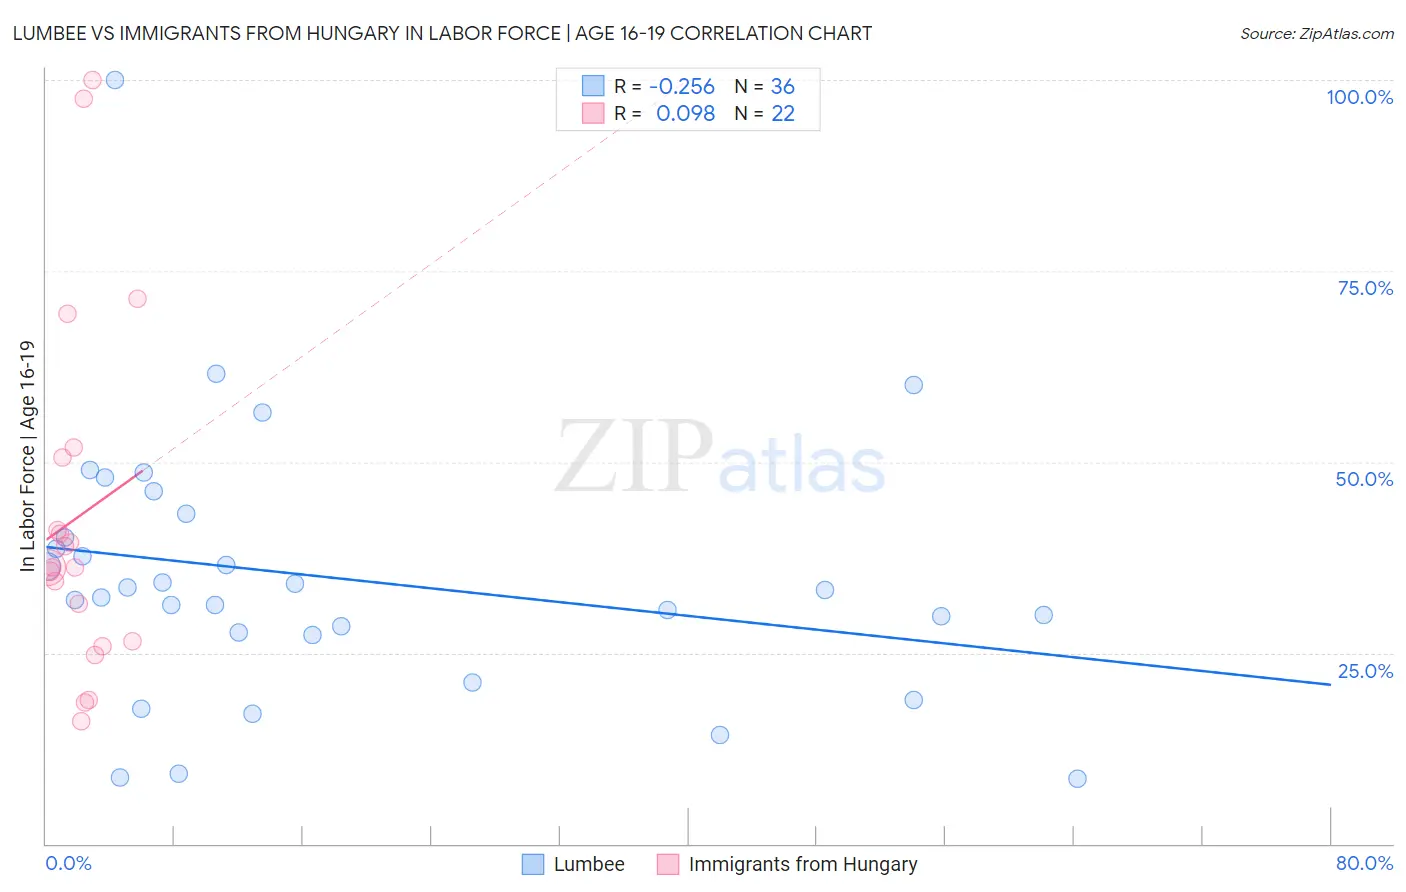
Lumbee vs Immigrants from Hungary In Labor Force | Age 16-19 Correlation Chart
The statistical analysis conducted on geographies consisting of 92,241,195 people shows a weak negative correlation between the proportion of Lumbee and labor force participation rate among population between the ages 16 and 19 in the United States with a correlation coefficient (R) of -0.256 and weighted average of 31.0%. Similarly, the statistical analysis conducted on geographies consisting of 195,472,897 people shows a slight positive correlation between the proportion of Immigrants from Hungary and labor force participation rate among population between the ages 16 and 19 in the United States with a correlation coefficient (R) of 0.098 and weighted average of 36.2%, a difference of 16.7%.
In Labor Force | Age 16-19 Correlation Summary
| Measurement | Lumbee | Immigrants from Hungary |
| Minimum | 8.5% | 16.1% |
| Maximum | 100.0% | 100.0% |
| Range | 91.5% | 83.9% |
| Mean | 34.8% | 42.8% |
| Median | 32.7% | 36.2% |
| Interquartile 25% (IQ1) | 27.5% | 26.5% |
| Interquartile 75% (IQ3) | 41.7% | 50.5% |
| Interquartile Range (IQR) | 14.2% | 24.0% |
| Standard Deviation (Sample) | 17.4% | 23.0% |
| Standard Deviation (Population) | 17.2% | 22.5% |
Similar Demographics by In Labor Force | Age 16-19
Demographics Similar to Lumbee by In Labor Force | Age 16-19
In terms of in labor force | age 16-19, the demographic groups most similar to Lumbee are Barbadian (31.0%, a difference of 0.12%), Immigrants from Ecuador (31.0%, a difference of 0.15%), Trinidadian and Tobagonian (30.9%, a difference of 0.15%), Immigrants from Taiwan (31.0%, a difference of 0.19%), and Immigrants from Dominican Republic (31.1%, a difference of 0.35%).
| Demographics | Rating | Rank | In Labor Force | Age 16-19 |
| Immigrants | Caribbean | 0.0 /100 | #323 | Tragic 31.2% |
| Dominicans | 0.0 /100 | #324 | Tragic 31.2% |
| Immigrants | China | 0.0 /100 | #325 | Tragic 31.1% |
| Immigrants | Dominican Republic | 0.0 /100 | #326 | Tragic 31.1% |
| Immigrants | Taiwan | 0.0 /100 | #327 | Tragic 31.0% |
| Immigrants | Ecuador | 0.0 /100 | #328 | Tragic 31.0% |
| Barbadians | 0.0 /100 | #329 | Tragic 31.0% |
| Lumbee | 0.0 /100 | #330 | Tragic 31.0% |
| Trinidadians and Tobagonians | 0.0 /100 | #331 | Tragic 30.9% |
| Immigrants | Israel | 0.0 /100 | #332 | Tragic 30.5% |
| Immigrants | Hong Kong | 0.0 /100 | #333 | Tragic 30.5% |
| Puerto Ricans | 0.0 /100 | #334 | Tragic 30.3% |
| Immigrants | Cuba | 0.0 /100 | #335 | Tragic 30.2% |
| Immigrants | Trinidad and Tobago | 0.0 /100 | #336 | Tragic 30.2% |
| Immigrants | Bangladesh | 0.0 /100 | #337 | Tragic 30.0% |
Demographics Similar to Immigrants from Hungary by In Labor Force | Age 16-19
In terms of in labor force | age 16-19, the demographic groups most similar to Immigrants from Hungary are Panamanian (36.1%, a difference of 0.010%), Immigrants from Croatia (36.1%, a difference of 0.080%), Immigrants from Europe (36.2%, a difference of 0.18%), Afghan (36.1%, a difference of 0.20%), and Immigrants from Denmark (36.1%, a difference of 0.25%).
| Demographics | Rating | Rank | In Labor Force | Age 16-19 |
| Immigrants | Italy | 39.1 /100 | #182 | Fair 36.4% |
| Eastern Europeans | 38.8 /100 | #183 | Fair 36.4% |
| Costa Ricans | 36.1 /100 | #184 | Fair 36.3% |
| Bhutanese | 35.3 /100 | #185 | Fair 36.3% |
| Immigrants | Romania | 34.0 /100 | #186 | Fair 36.3% |
| Immigrants | Afghanistan | 34.0 /100 | #187 | Fair 36.3% |
| Immigrants | Europe | 31.8 /100 | #188 | Fair 36.2% |
| Immigrants | Hungary | 28.8 /100 | #189 | Fair 36.2% |
| Panamanians | 28.6 /100 | #190 | Fair 36.1% |
| Immigrants | Croatia | 27.5 /100 | #191 | Fair 36.1% |
| Afghans | 25.7 /100 | #192 | Fair 36.1% |
| Immigrants | Denmark | 25.0 /100 | #193 | Fair 36.1% |
| Nigerians | 24.6 /100 | #194 | Fair 36.1% |
| Bolivians | 23.3 /100 | #195 | Fair 36.0% |
| Mexican American Indians | 21.1 /100 | #196 | Fair 36.0% |