Immigrants from Nepal vs Immigrants from Haiti In Labor Force | Age 16-19
COMPARE
Immigrants from Nepal
Immigrants from Haiti
In Labor Force | Age 16-19
In Labor Force | Age 16-19 Comparison
Immigrants from Nepal
Immigrants from Haiti
38.3%
IN LABOR FORCE | AGE 16-19
97.8/ 100
METRIC RATING
118th/ 347
METRIC RANK
33.2%
IN LABOR FORCE | AGE 16-19
0.1/ 100
METRIC RATING
297th/ 347
METRIC RANK
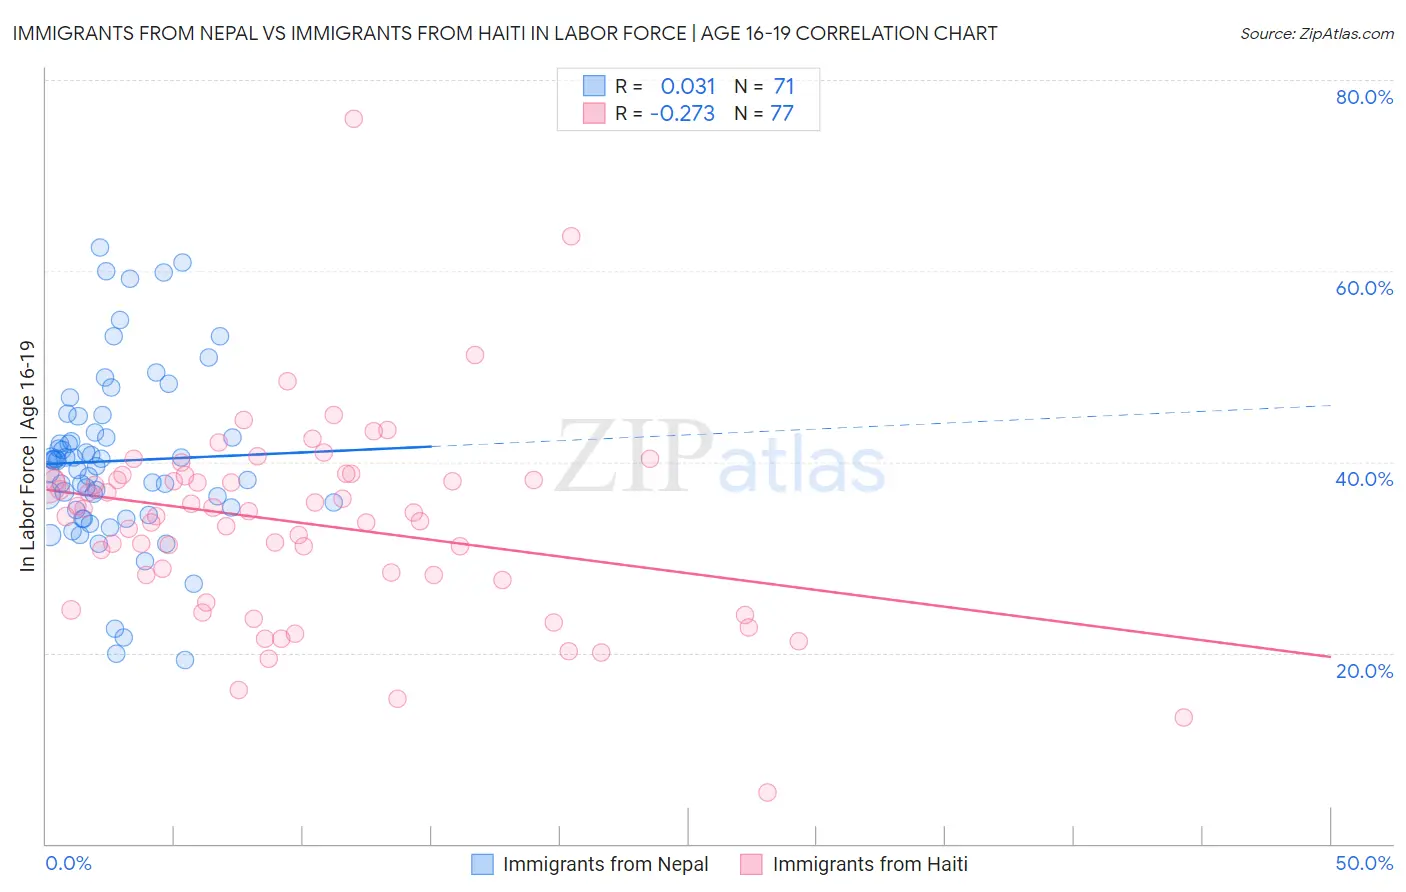
Immigrants from Nepal vs Immigrants from Haiti In Labor Force | Age 16-19 Correlation Chart
The statistical analysis conducted on geographies consisting of 186,763,001 people shows no correlation between the proportion of Immigrants from Nepal and labor force participation rate among population between the ages 16 and 19 in the United States with a correlation coefficient (R) of 0.031 and weighted average of 38.3%. Similarly, the statistical analysis conducted on geographies consisting of 225,034,404 people shows a weak negative correlation between the proportion of Immigrants from Haiti and labor force participation rate among population between the ages 16 and 19 in the United States with a correlation coefficient (R) of -0.273 and weighted average of 33.2%, a difference of 15.5%.
In Labor Force | Age 16-19 Correlation Summary
| Measurement | Immigrants from Nepal | Immigrants from Haiti |
| Minimum | 19.2% | 5.3% |
| Maximum | 62.5% | 76.0% |
| Range | 43.3% | 70.7% |
| Mean | 40.1% | 33.5% |
| Median | 40.1% | 34.6% |
| Interquartile 25% (IQ1) | 35.0% | 27.9% |
| Interquartile 75% (IQ3) | 43.1% | 38.3% |
| Interquartile Range (IQR) | 8.1% | 10.5% |
| Standard Deviation (Sample) | 9.0% | 10.4% |
| Standard Deviation (Population) | 9.0% | 10.3% |
Similar Demographics by In Labor Force | Age 16-19
Demographics Similar to Immigrants from Nepal by In Labor Force | Age 16-19
In terms of in labor force | age 16-19, the demographic groups most similar to Immigrants from Nepal are Chickasaw (38.3%, a difference of 0.010%), Assyrian/Chaldean/Syriac (38.3%, a difference of 0.020%), Colville (38.3%, a difference of 0.060%), Bulgarian (38.3%, a difference of 0.070%), and Ukrainian (38.3%, a difference of 0.10%).
| Demographics | Rating | Rank | In Labor Force | Age 16-19 |
| Crow | 98.5 /100 | #111 | Exceptional 38.5% |
| Immigrants | Scotland | 98.5 /100 | #112 | Exceptional 38.5% |
| Sub-Saharan Africans | 98.3 /100 | #113 | Exceptional 38.4% |
| Hawaiians | 98.2 /100 | #114 | Exceptional 38.4% |
| Bulgarians | 97.9 /100 | #115 | Exceptional 38.3% |
| Colville | 97.9 /100 | #116 | Exceptional 38.3% |
| Chickasaw | 97.8 /100 | #117 | Exceptional 38.3% |
| Immigrants | Nepal | 97.8 /100 | #118 | Exceptional 38.3% |
| Assyrians/Chaldeans/Syriacs | 97.8 /100 | #119 | Exceptional 38.3% |
| Ukrainians | 97.6 /100 | #120 | Exceptional 38.3% |
| Ethiopians | 97.4 /100 | #121 | Exceptional 38.2% |
| Guamanians/Chamorros | 97.4 /100 | #122 | Exceptional 38.2% |
| Seminole | 96.7 /100 | #123 | Exceptional 38.1% |
| Immigrants | England | 96.4 /100 | #124 | Exceptional 38.1% |
| Immigrants | Africa | 96.1 /100 | #125 | Exceptional 38.0% |
Demographics Similar to Immigrants from Haiti by In Labor Force | Age 16-19
In terms of in labor force | age 16-19, the demographic groups most similar to Immigrants from Haiti are Jamaican (33.2%, a difference of 0.090%), Yup'ik (33.3%, a difference of 0.22%), Argentinean (33.3%, a difference of 0.33%), Immigrants from South America (33.3%, a difference of 0.34%), and Iranian (33.0%, a difference of 0.51%).
| Demographics | Rating | Rank | In Labor Force | Age 16-19 |
| Immigrants | Colombia | 0.1 /100 | #290 | Tragic 33.5% |
| Immigrants | Belarus | 0.1 /100 | #291 | Tragic 33.4% |
| Haitians | 0.1 /100 | #292 | Tragic 33.4% |
| Immigrants | South America | 0.1 /100 | #293 | Tragic 33.3% |
| Argentineans | 0.1 /100 | #294 | Tragic 33.3% |
| Yup'ik | 0.1 /100 | #295 | Tragic 33.3% |
| Jamaicans | 0.1 /100 | #296 | Tragic 33.2% |
| Immigrants | Haiti | 0.1 /100 | #297 | Tragic 33.2% |
| Iranians | 0.0 /100 | #298 | Tragic 33.0% |
| Armenians | 0.0 /100 | #299 | Tragic 32.9% |
| Immigrants | Argentina | 0.0 /100 | #300 | Tragic 32.9% |
| Okinawans | 0.0 /100 | #301 | Tragic 32.8% |
| Belizeans | 0.0 /100 | #302 | Tragic 32.8% |
| Immigrants | Dominica | 0.0 /100 | #303 | Tragic 32.5% |
| Israelis | 0.0 /100 | #304 | Tragic 32.4% |