Taiwanese vs Immigrants from Ireland In Labor Force | Age 16-19
COMPARE
Taiwanese
Immigrants from Ireland
In Labor Force | Age 16-19
In Labor Force | Age 16-19 Comparison
Taiwanese
Immigrants from Ireland
33.8%
IN LABOR FORCE | AGE 16-19
0.3/ 100
METRIC RATING
280th/ 347
METRIC RANK
35.0%
IN LABOR FORCE | AGE 16-19
2.9/ 100
METRIC RATING
241st/ 347
METRIC RANK
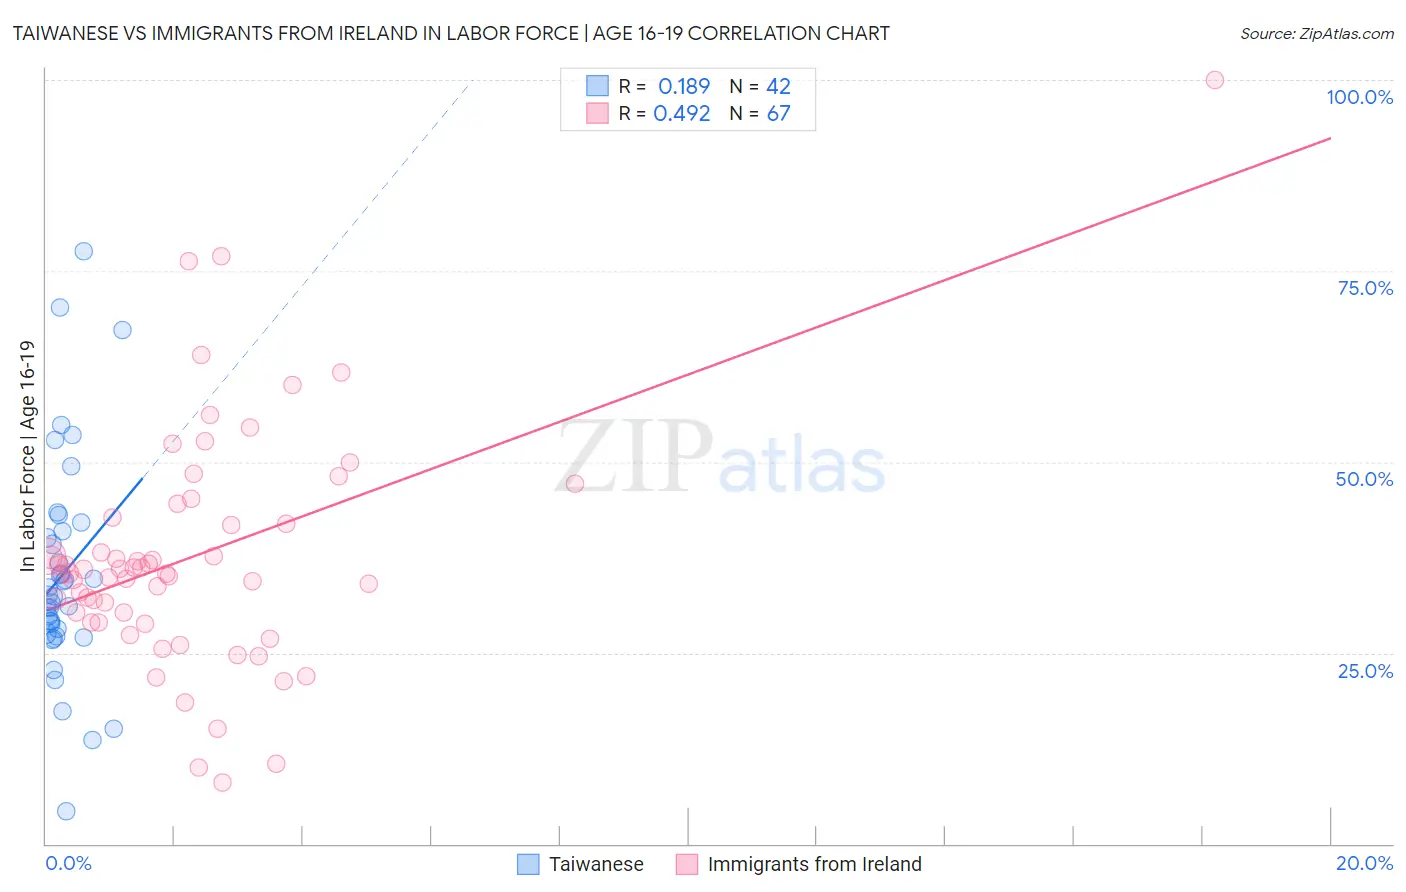
Taiwanese vs Immigrants from Ireland In Labor Force | Age 16-19 Correlation Chart
The statistical analysis conducted on geographies consisting of 31,721,298 people shows a poor positive correlation between the proportion of Taiwanese and labor force participation rate among population between the ages 16 and 19 in the United States with a correlation coefficient (R) of 0.189 and weighted average of 33.8%. Similarly, the statistical analysis conducted on geographies consisting of 240,424,944 people shows a moderate positive correlation between the proportion of Immigrants from Ireland and labor force participation rate among population between the ages 16 and 19 in the United States with a correlation coefficient (R) of 0.492 and weighted average of 35.0%, a difference of 3.3%.
In Labor Force | Age 16-19 Correlation Summary
| Measurement | Taiwanese | Immigrants from Ireland |
| Minimum | 4.3% | 8.0% |
| Maximum | 77.6% | 100.0% |
| Range | 73.3% | 92.0% |
| Mean | 35.3% | 37.6% |
| Median | 32.5% | 35.5% |
| Interquartile 25% (IQ1) | 27.6% | 29.0% |
| Interquartile 75% (IQ3) | 40.9% | 42.8% |
| Interquartile Range (IQR) | 13.3% | 13.8% |
| Standard Deviation (Sample) | 14.5% | 15.5% |
| Standard Deviation (Population) | 14.3% | 15.4% |
Similar Demographics by In Labor Force | Age 16-19
Demographics Similar to Taiwanese by In Labor Force | Age 16-19
In terms of in labor force | age 16-19, the demographic groups most similar to Taiwanese are Paraguayan (33.8%, a difference of 0.010%), Cypriot (33.8%, a difference of 0.010%), Colombian (33.8%, a difference of 0.020%), Immigrants from Korea (33.8%, a difference of 0.020%), and Menominee (33.9%, a difference of 0.090%).
| Demographics | Rating | Rank | In Labor Force | Age 16-19 |
| Immigrants | Panama | 0.4 /100 | #273 | Tragic 34.0% |
| Venezuelans | 0.3 /100 | #274 | Tragic 34.0% |
| Immigrants | Fiji | 0.3 /100 | #275 | Tragic 33.9% |
| Immigrants | Latin America | 0.3 /100 | #276 | Tragic 33.9% |
| Menominee | 0.3 /100 | #277 | Tragic 33.9% |
| Colombians | 0.3 /100 | #278 | Tragic 33.8% |
| Paraguayans | 0.3 /100 | #279 | Tragic 33.8% |
| Taiwanese | 0.3 /100 | #280 | Tragic 33.8% |
| Cypriots | 0.3 /100 | #281 | Tragic 33.8% |
| Immigrants | Korea | 0.3 /100 | #282 | Tragic 33.8% |
| Immigrants | Venezuela | 0.2 /100 | #283 | Tragic 33.7% |
| Immigrants | Spain | 0.2 /100 | #284 | Tragic 33.7% |
| U.S. Virgin Islanders | 0.2 /100 | #285 | Tragic 33.6% |
| South Americans | 0.2 /100 | #286 | Tragic 33.6% |
| Nepalese | 0.1 /100 | #287 | Tragic 33.5% |
Demographics Similar to Immigrants from Ireland by In Labor Force | Age 16-19
In terms of in labor force | age 16-19, the demographic groups most similar to Immigrants from Ireland are Immigrants from Central America (35.0%, a difference of 0.030%), Inupiat (35.0%, a difference of 0.13%), Uruguayan (34.9%, a difference of 0.13%), Pueblo (34.9%, a difference of 0.15%), and Immigrants from Turkey (34.9%, a difference of 0.17%).
| Demographics | Rating | Rank | In Labor Force | Age 16-19 |
| Immigrants | Mexico | 4.2 /100 | #234 | Tragic 35.1% |
| Immigrants | Philippines | 4.0 /100 | #235 | Tragic 35.1% |
| Immigrants | Australia | 3.6 /100 | #236 | Tragic 35.1% |
| Immigrants | India | 3.5 /100 | #237 | Tragic 35.0% |
| Immigrants | Vietnam | 3.4 /100 | #238 | Tragic 35.0% |
| Inupiat | 3.2 /100 | #239 | Tragic 35.0% |
| Immigrants | Central America | 3.0 /100 | #240 | Tragic 35.0% |
| Immigrants | Ireland | 2.9 /100 | #241 | Tragic 35.0% |
| Uruguayans | 2.6 /100 | #242 | Tragic 34.9% |
| Pueblo | 2.6 /100 | #243 | Tragic 34.9% |
| Immigrants | Turkey | 2.6 /100 | #244 | Tragic 34.9% |
| Immigrants | Greece | 2.4 /100 | #245 | Tragic 34.9% |
| Immigrants | Sri Lanka | 2.4 /100 | #246 | Tragic 34.9% |
| Laotians | 2.4 /100 | #247 | Tragic 34.9% |
| Central Americans | 2.2 /100 | #248 | Tragic 34.8% |