Czechoslovakian vs Immigrants from Ireland In Labor Force | Age 16-19
COMPARE
Czechoslovakian
Immigrants from Ireland
In Labor Force | Age 16-19
In Labor Force | Age 16-19 Comparison
Czechoslovakians
Immigrants from Ireland
41.9%
IN LABOR FORCE | AGE 16-19
100.0/ 100
METRIC RATING
32nd/ 347
METRIC RANK
35.0%
IN LABOR FORCE | AGE 16-19
2.9/ 100
METRIC RATING
241st/ 347
METRIC RANK
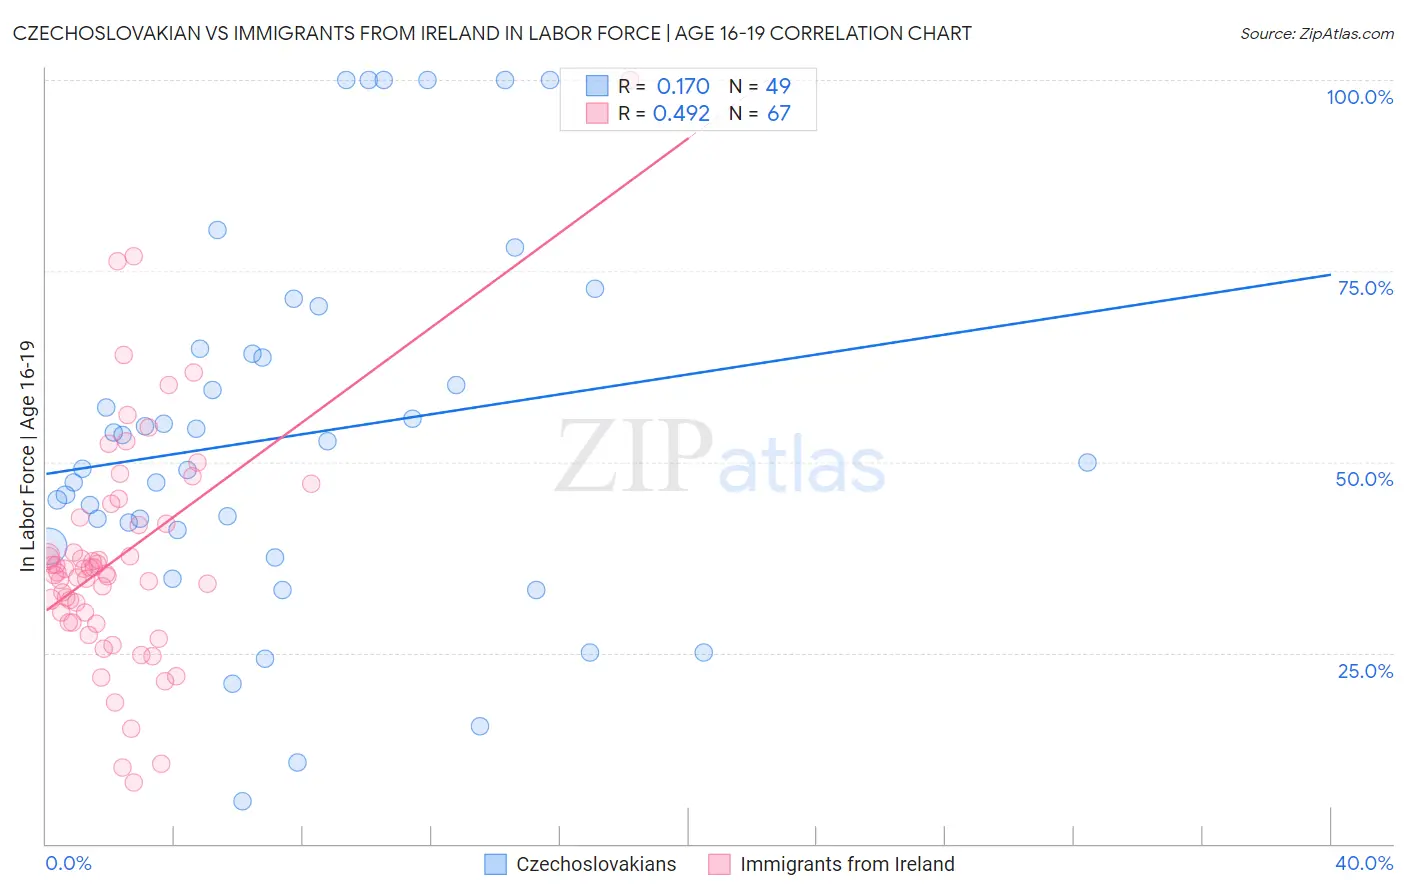
Czechoslovakian vs Immigrants from Ireland In Labor Force | Age 16-19 Correlation Chart
The statistical analysis conducted on geographies consisting of 368,118,487 people shows a poor positive correlation between the proportion of Czechoslovakians and labor force participation rate among population between the ages 16 and 19 in the United States with a correlation coefficient (R) of 0.170 and weighted average of 41.9%. Similarly, the statistical analysis conducted on geographies consisting of 240,424,944 people shows a moderate positive correlation between the proportion of Immigrants from Ireland and labor force participation rate among population between the ages 16 and 19 in the United States with a correlation coefficient (R) of 0.492 and weighted average of 35.0%, a difference of 19.8%.
In Labor Force | Age 16-19 Correlation Summary
| Measurement | Czechoslovakian | Immigrants from Ireland |
| Minimum | 5.6% | 8.0% |
| Maximum | 100.0% | 100.0% |
| Range | 94.4% | 92.0% |
| Mean | 53.4% | 37.6% |
| Median | 50.0% | 35.5% |
| Interquartile 25% (IQ1) | 40.0% | 29.0% |
| Interquartile 75% (IQ3) | 64.5% | 42.8% |
| Interquartile Range (IQR) | 24.5% | 13.8% |
| Standard Deviation (Sample) | 23.9% | 15.5% |
| Standard Deviation (Population) | 23.7% | 15.4% |
Similar Demographics by In Labor Force | Age 16-19
Demographics Similar to Czechoslovakians by In Labor Force | Age 16-19
In terms of in labor force | age 16-19, the demographic groups most similar to Czechoslovakians are Liberian (41.8%, a difference of 0.14%), Irish (42.0%, a difference of 0.20%), Immigrants from Bosnia and Herzegovina (41.8%, a difference of 0.22%), Yugoslavian (41.8%, a difference of 0.24%), and Scottish (42.0%, a difference of 0.27%).
| Demographics | Rating | Rank | In Labor Force | Age 16-19 |
| German Russians | 100.0 /100 | #25 | Exceptional 42.4% |
| English | 100.0 /100 | #26 | Exceptional 42.4% |
| Welsh | 100.0 /100 | #27 | Exceptional 42.3% |
| Poles | 100.0 /100 | #28 | Exceptional 42.1% |
| French | 100.0 /100 | #29 | Exceptional 42.1% |
| Scottish | 100.0 /100 | #30 | Exceptional 42.0% |
| Irish | 100.0 /100 | #31 | Exceptional 42.0% |
| Czechoslovakians | 100.0 /100 | #32 | Exceptional 41.9% |
| Liberians | 100.0 /100 | #33 | Exceptional 41.8% |
| Immigrants | Bosnia and Herzegovina | 100.0 /100 | #34 | Exceptional 41.8% |
| Yugoslavians | 100.0 /100 | #35 | Exceptional 41.8% |
| Immigrants | Azores | 100.0 /100 | #36 | Exceptional 41.7% |
| Immigrants | Congo | 100.0 /100 | #37 | Exceptional 41.7% |
| Sioux | 100.0 /100 | #38 | Exceptional 41.5% |
| Scotch-Irish | 100.0 /100 | #39 | Exceptional 41.5% |
Demographics Similar to Immigrants from Ireland by In Labor Force | Age 16-19
In terms of in labor force | age 16-19, the demographic groups most similar to Immigrants from Ireland are Immigrants from Central America (35.0%, a difference of 0.030%), Inupiat (35.0%, a difference of 0.13%), Uruguayan (34.9%, a difference of 0.13%), Pueblo (34.9%, a difference of 0.15%), and Immigrants from Turkey (34.9%, a difference of 0.17%).
| Demographics | Rating | Rank | In Labor Force | Age 16-19 |
| Immigrants | Mexico | 4.2 /100 | #234 | Tragic 35.1% |
| Immigrants | Philippines | 4.0 /100 | #235 | Tragic 35.1% |
| Immigrants | Australia | 3.6 /100 | #236 | Tragic 35.1% |
| Immigrants | India | 3.5 /100 | #237 | Tragic 35.0% |
| Immigrants | Vietnam | 3.4 /100 | #238 | Tragic 35.0% |
| Inupiat | 3.2 /100 | #239 | Tragic 35.0% |
| Immigrants | Central America | 3.0 /100 | #240 | Tragic 35.0% |
| Immigrants | Ireland | 2.9 /100 | #241 | Tragic 35.0% |
| Uruguayans | 2.6 /100 | #242 | Tragic 34.9% |
| Pueblo | 2.6 /100 | #243 | Tragic 34.9% |
| Immigrants | Turkey | 2.6 /100 | #244 | Tragic 34.9% |
| Immigrants | Greece | 2.4 /100 | #245 | Tragic 34.9% |
| Immigrants | Sri Lanka | 2.4 /100 | #246 | Tragic 34.9% |
| Laotians | 2.4 /100 | #247 | Tragic 34.9% |
| Central Americans | 2.2 /100 | #248 | Tragic 34.8% |