Lithuanian vs Hungarian In Labor Force | Age 20-24
COMPARE
Lithuanian
Hungarian
In Labor Force | Age 20-24
In Labor Force | Age 20-24 Comparison
Lithuanians
Hungarians
77.0%
IN LABOR FORCE | AGE 20-24
99.9/ 100
METRIC RATING
63rd/ 347
METRIC RANK
76.3%
IN LABOR FORCE | AGE 20-24
98.9/ 100
METRIC RATING
93rd/ 347
METRIC RANK
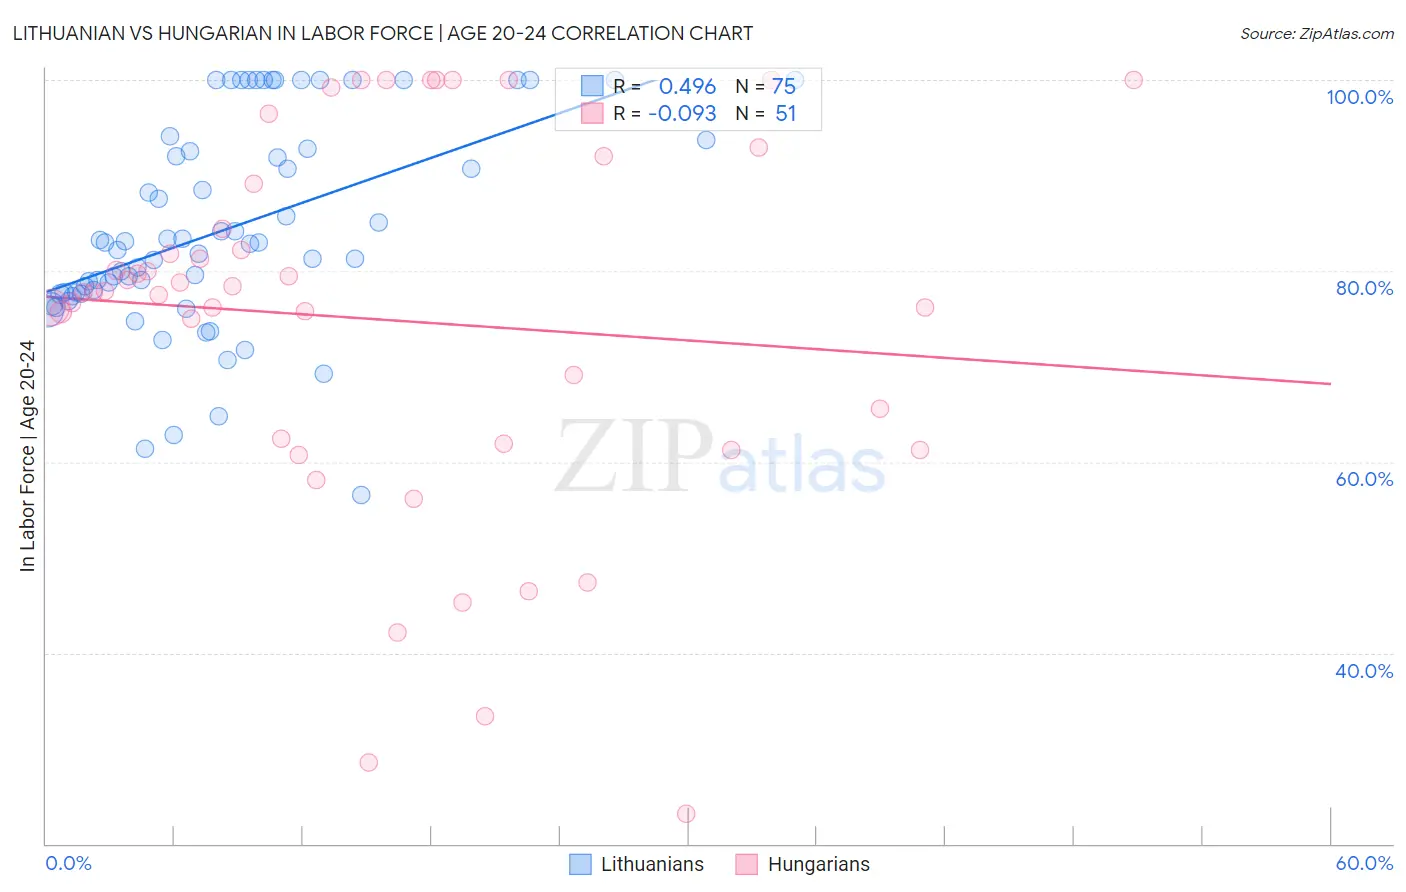
Lithuanian vs Hungarian In Labor Force | Age 20-24 Correlation Chart
The statistical analysis conducted on geographies consisting of 421,633,520 people shows a moderate positive correlation between the proportion of Lithuanians and labor force participation rate among population between the ages 20 and 24 in the United States with a correlation coefficient (R) of 0.496 and weighted average of 77.0%. Similarly, the statistical analysis conducted on geographies consisting of 485,725,263 people shows a slight negative correlation between the proportion of Hungarians and labor force participation rate among population between the ages 20 and 24 in the United States with a correlation coefficient (R) of -0.093 and weighted average of 76.3%, a difference of 0.89%.
In Labor Force | Age 20-24 Correlation Summary
| Measurement | Lithuanian | Hungarian |
| Minimum | 56.5% | 23.1% |
| Maximum | 100.0% | 100.0% |
| Range | 43.5% | 76.9% |
| Mean | 84.3% | 74.9% |
| Median | 82.9% | 77.8% |
| Interquartile 25% (IQ1) | 77.6% | 61.9% |
| Interquartile 75% (IQ3) | 92.8% | 89.1% |
| Interquartile Range (IQR) | 15.2% | 27.2% |
| Standard Deviation (Sample) | 10.8% | 19.5% |
| Standard Deviation (Population) | 10.7% | 19.3% |
Similar Demographics by In Labor Force | Age 20-24
Demographics Similar to Lithuanians by In Labor Force | Age 20-24
In terms of in labor force | age 20-24, the demographic groups most similar to Lithuanians are Immigrants from Kenya (77.0%, a difference of 0.0%), Immigrants from Eritrea (77.0%, a difference of 0.010%), White/Caucasian (76.9%, a difference of 0.040%), Kenyan (77.0%, a difference of 0.060%), and Scotch-Irish (77.0%, a difference of 0.090%).
| Demographics | Rating | Rank | In Labor Force | Age 20-24 |
| Europeans | 99.9 /100 | #56 | Exceptional 77.1% |
| Chippewa | 99.9 /100 | #57 | Exceptional 77.1% |
| Hawaiians | 99.9 /100 | #58 | Exceptional 77.0% |
| Scotch-Irish | 99.9 /100 | #59 | Exceptional 77.0% |
| Kenyans | 99.9 /100 | #60 | Exceptional 77.0% |
| Immigrants | Eritrea | 99.9 /100 | #61 | Exceptional 77.0% |
| Immigrants | Kenya | 99.9 /100 | #62 | Exceptional 77.0% |
| Lithuanians | 99.9 /100 | #63 | Exceptional 77.0% |
| Whites/Caucasians | 99.9 /100 | #64 | Exceptional 76.9% |
| Crow | 99.9 /100 | #65 | Exceptional 76.9% |
| Icelanders | 99.9 /100 | #66 | Exceptional 76.9% |
| Slavs | 99.9 /100 | #67 | Exceptional 76.9% |
| French American Indians | 99.8 /100 | #68 | Exceptional 76.8% |
| Immigrants | Sudan | 99.8 /100 | #69 | Exceptional 76.8% |
| Ottawa | 99.8 /100 | #70 | Exceptional 76.8% |
Demographics Similar to Hungarians by In Labor Force | Age 20-24
In terms of in labor force | age 20-24, the demographic groups most similar to Hungarians are Maltese (76.3%, a difference of 0.020%), Sierra Leonean (76.3%, a difference of 0.050%), Immigrants from Burma/Myanmar (76.3%, a difference of 0.070%), Potawatomi (76.2%, a difference of 0.090%), and Immigrants from Germany (76.2%, a difference of 0.10%).
| Demographics | Rating | Rank | In Labor Force | Age 20-24 |
| Immigrants | Iraq | 99.3 /100 | #86 | Exceptional 76.4% |
| Immigrants | Thailand | 99.3 /100 | #87 | Exceptional 76.4% |
| Spanish | 99.2 /100 | #88 | Exceptional 76.4% |
| Bulgarians | 99.2 /100 | #89 | Exceptional 76.4% |
| Immigrants | Burma/Myanmar | 99.1 /100 | #90 | Exceptional 76.3% |
| Sierra Leoneans | 99.0 /100 | #91 | Exceptional 76.3% |
| Maltese | 98.9 /100 | #92 | Exceptional 76.3% |
| Hungarians | 98.9 /100 | #93 | Exceptional 76.3% |
| Potawatomi | 98.5 /100 | #94 | Exceptional 76.2% |
| Immigrants | Germany | 98.5 /100 | #95 | Exceptional 76.2% |
| Immigrants | Nonimmigrants | 98.5 /100 | #96 | Exceptional 76.2% |
| Immigrants | Lithuania | 98.0 /100 | #97 | Exceptional 76.1% |
| Immigrants | Oceania | 98.0 /100 | #98 | Exceptional 76.1% |
| Americans | 97.8 /100 | #99 | Exceptional 76.1% |
| Shoshone | 97.8 /100 | #100 | Exceptional 76.1% |