Native Hawaiian vs Hungarian In Labor Force | Age 16-19
COMPARE
Native Hawaiian
Hungarian
In Labor Force | Age 16-19
In Labor Force | Age 16-19 Comparison
Native Hawaiians
Hungarians
37.4%
IN LABOR FORCE | AGE 16-19
85.0/ 100
METRIC RATING
149th/ 347
METRIC RANK
39.8%
IN LABOR FORCE | AGE 16-19
99.9/ 100
METRIC RATING
74th/ 347
METRIC RANK
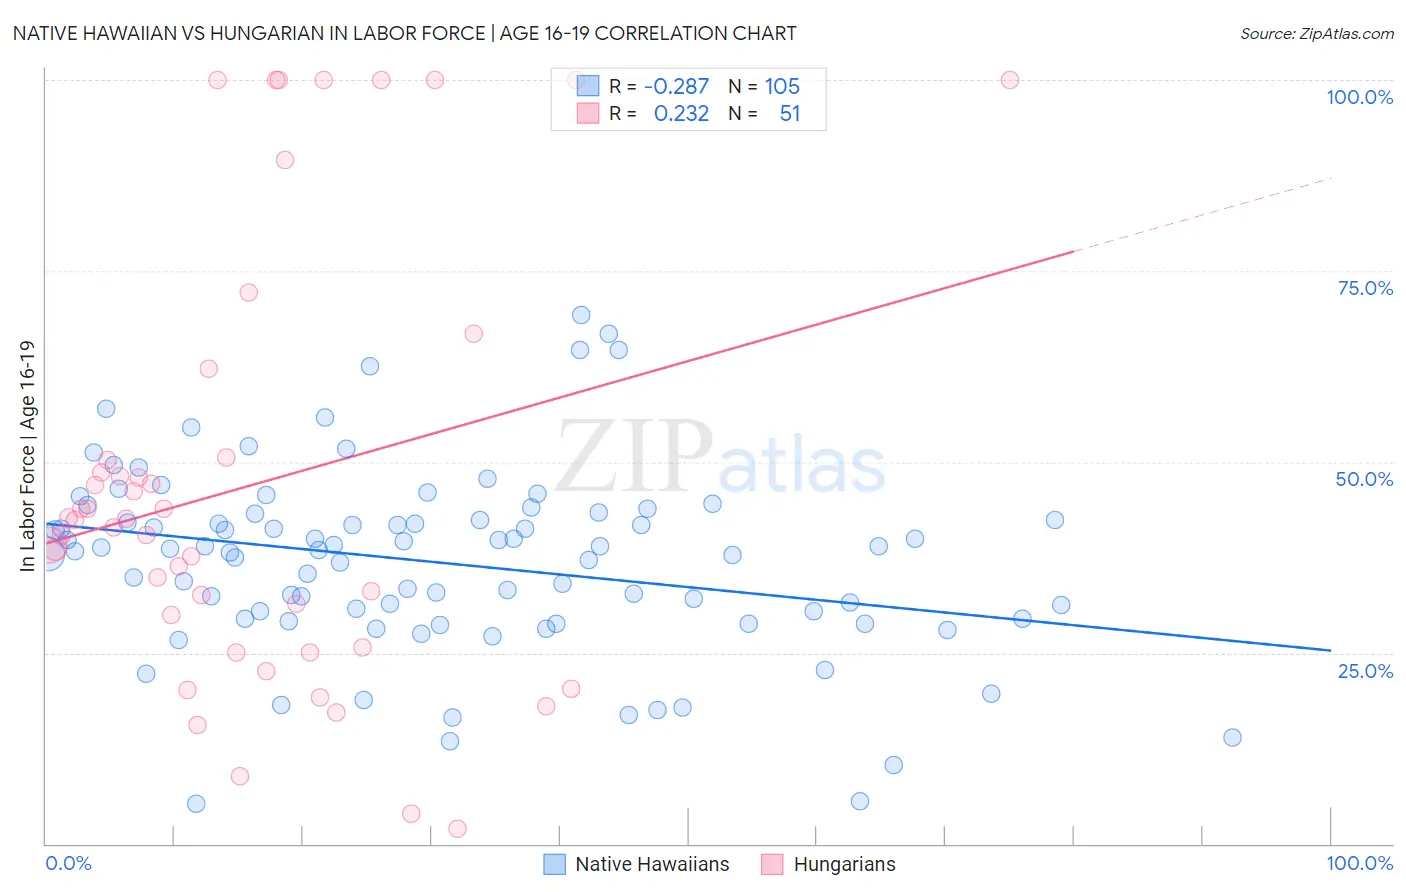
Native Hawaiian vs Hungarian In Labor Force | Age 16-19 Correlation Chart
The statistical analysis conducted on geographies consisting of 331,673,637 people shows a weak negative correlation between the proportion of Native Hawaiians and labor force participation rate among population between the ages 16 and 19 in the United States with a correlation coefficient (R) of -0.287 and weighted average of 37.4%. Similarly, the statistical analysis conducted on geographies consisting of 484,680,746 people shows a weak positive correlation between the proportion of Hungarians and labor force participation rate among population between the ages 16 and 19 in the United States with a correlation coefficient (R) of 0.232 and weighted average of 39.8%, a difference of 6.6%.
In Labor Force | Age 16-19 Correlation Summary
| Measurement | Native Hawaiian | Hungarian |
| Minimum | 5.3% | 2.0% |
| Maximum | 69.2% | 100.0% |
| Range | 63.9% | 98.0% |
| Mean | 36.8% | 47.0% |
| Median | 38.4% | 42.4% |
| Interquartile 25% (IQ1) | 29.4% | 25.7% |
| Interquartile 75% (IQ3) | 42.8% | 50.5% |
| Interquartile Range (IQR) | 13.3% | 24.8% |
| Standard Deviation (Sample) | 12.2% | 28.1% |
| Standard Deviation (Population) | 12.2% | 27.8% |
Similar Demographics by In Labor Force | Age 16-19
Demographics Similar to Native Hawaiians by In Labor Force | Age 16-19
In terms of in labor force | age 16-19, the demographic groups most similar to Native Hawaiians are Tsimshian (37.4%, a difference of 0.030%), Immigrants from Poland (37.3%, a difference of 0.050%), Immigrants from Sierra Leone (37.3%, a difference of 0.13%), Romanian (37.5%, a difference of 0.24%), and Arapaho (37.3%, a difference of 0.28%).
| Demographics | Rating | Rank | In Labor Force | Age 16-19 |
| Sierra Leoneans | 89.7 /100 | #142 | Excellent 37.6% |
| Pakistanis | 89.5 /100 | #143 | Excellent 37.6% |
| Japanese | 89.3 /100 | #144 | Excellent 37.5% |
| Paiute | 89.3 /100 | #145 | Excellent 37.5% |
| Immigrants | Western Europe | 88.9 /100 | #146 | Excellent 37.5% |
| Brazilians | 88.7 /100 | #147 | Excellent 37.5% |
| Romanians | 87.3 /100 | #148 | Excellent 37.5% |
| Native Hawaiians | 85.0 /100 | #149 | Excellent 37.4% |
| Tsimshian | 84.7 /100 | #150 | Excellent 37.4% |
| Immigrants | Poland | 84.4 /100 | #151 | Excellent 37.3% |
| Immigrants | Sierra Leone | 83.6 /100 | #152 | Excellent 37.3% |
| Arapaho | 81.8 /100 | #153 | Excellent 37.3% |
| Immigrants | Bulgaria | 81.6 /100 | #154 | Excellent 37.3% |
| Immigrants | Lithuania | 80.7 /100 | #155 | Excellent 37.2% |
| Kiowa | 80.4 /100 | #156 | Excellent 37.2% |
Demographics Similar to Hungarians by In Labor Force | Age 16-19
In terms of in labor force | age 16-19, the demographic groups most similar to Hungarians are French American Indian (39.8%, a difference of 0.020%), Immigrants from Middle Africa (39.9%, a difference of 0.23%), Iroquois (39.9%, a difference of 0.26%), Serbian (39.9%, a difference of 0.27%), and Malaysian (39.7%, a difference of 0.29%).
| Demographics | Rating | Rank | In Labor Force | Age 16-19 |
| Canadians | 100.0 /100 | #67 | Exceptional 40.1% |
| Italians | 99.9 /100 | #68 | Exceptional 40.1% |
| Potawatomi | 99.9 /100 | #69 | Exceptional 40.0% |
| Portuguese | 99.9 /100 | #70 | Exceptional 40.0% |
| Serbians | 99.9 /100 | #71 | Exceptional 39.9% |
| Iroquois | 99.9 /100 | #72 | Exceptional 39.9% |
| Immigrants | Middle Africa | 99.9 /100 | #73 | Exceptional 39.9% |
| Hungarians | 99.9 /100 | #74 | Exceptional 39.8% |
| French American Indians | 99.9 /100 | #75 | Exceptional 39.8% |
| Malaysians | 99.9 /100 | #76 | Exceptional 39.7% |
| Immigrants | Portugal | 99.9 /100 | #77 | Exceptional 39.7% |
| Austrians | 99.8 /100 | #78 | Exceptional 39.5% |
| Marshallese | 99.8 /100 | #79 | Exceptional 39.5% |
| Immigrants | Iraq | 99.8 /100 | #80 | Exceptional 39.4% |
| Shoshone | 99.7 /100 | #81 | Exceptional 39.3% |