Immigrants from Japan vs Hungarian In Labor Force | Age 16-19
COMPARE
Immigrants from Japan
Hungarian
In Labor Force | Age 16-19
In Labor Force | Age 16-19 Comparison
Immigrants from Japan
Hungarians
34.7%
IN LABOR FORCE | AGE 16-19
1.5/ 100
METRIC RATING
253rd/ 347
METRIC RANK
39.8%
IN LABOR FORCE | AGE 16-19
99.9/ 100
METRIC RATING
74th/ 347
METRIC RANK
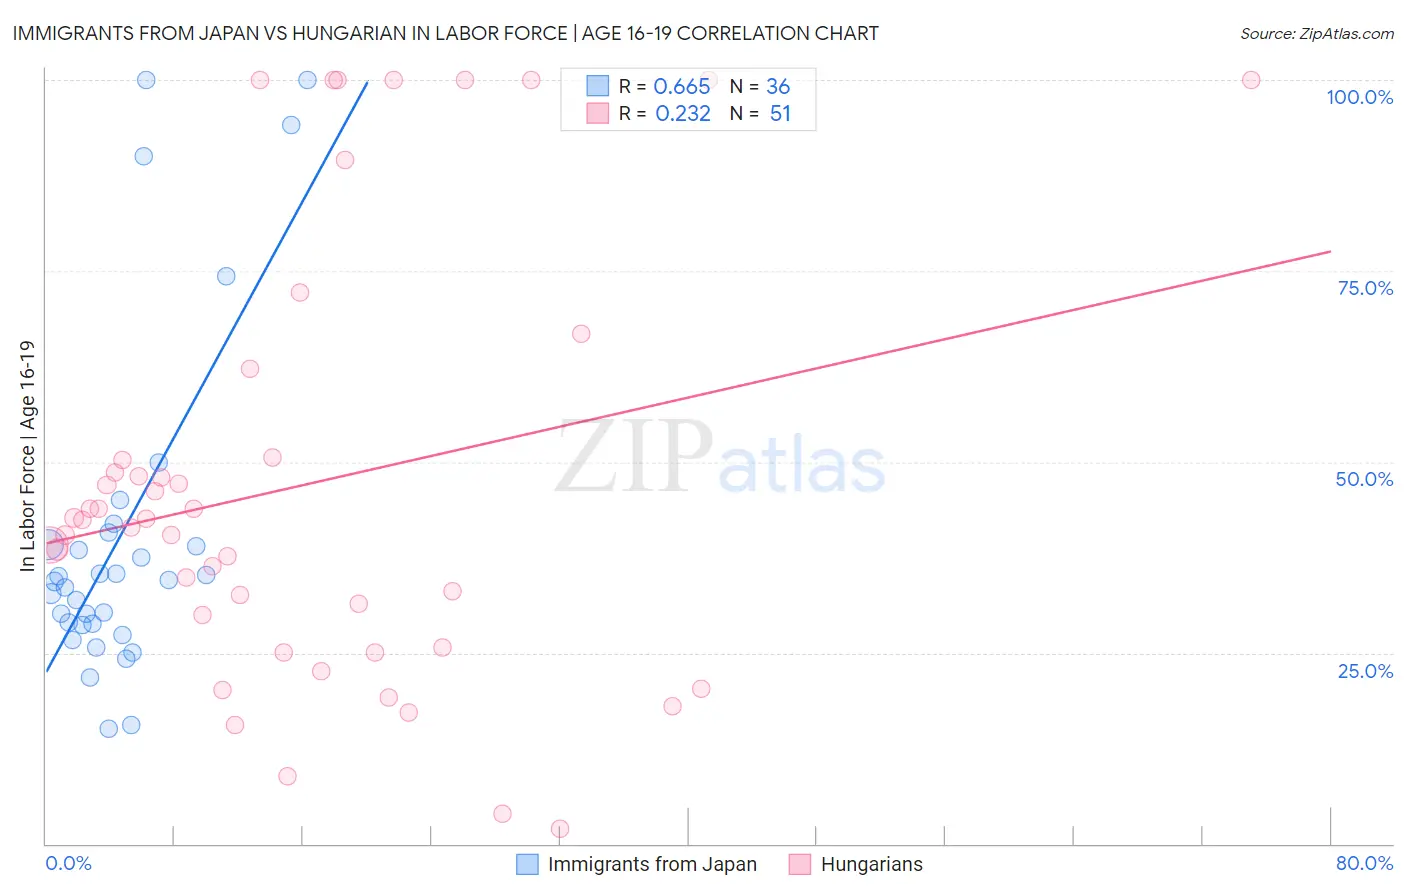
Immigrants from Japan vs Hungarian In Labor Force | Age 16-19 Correlation Chart
The statistical analysis conducted on geographies consisting of 339,742,908 people shows a significant positive correlation between the proportion of Immigrants from Japan and labor force participation rate among population between the ages 16 and 19 in the United States with a correlation coefficient (R) of 0.665 and weighted average of 34.7%. Similarly, the statistical analysis conducted on geographies consisting of 484,680,746 people shows a weak positive correlation between the proportion of Hungarians and labor force participation rate among population between the ages 16 and 19 in the United States with a correlation coefficient (R) of 0.232 and weighted average of 39.8%, a difference of 15.0%.
In Labor Force | Age 16-19 Correlation Summary
| Measurement | Immigrants from Japan | Hungarian |
| Minimum | 15.0% | 2.0% |
| Maximum | 100.0% | 100.0% |
| Range | 85.0% | 98.0% |
| Mean | 40.4% | 47.0% |
| Median | 34.4% | 42.4% |
| Interquartile 25% (IQ1) | 28.7% | 25.7% |
| Interquartile 75% (IQ3) | 39.9% | 50.5% |
| Interquartile Range (IQR) | 11.2% | 24.8% |
| Standard Deviation (Sample) | 22.4% | 28.1% |
| Standard Deviation (Population) | 22.0% | 27.8% |
Similar Demographics by In Labor Force | Age 16-19
Demographics Similar to Immigrants from Japan by In Labor Force | Age 16-19
In terms of in labor force | age 16-19, the demographic groups most similar to Immigrants from Japan are Bahamian (34.6%, a difference of 0.12%), Peruvian (34.6%, a difference of 0.16%), Immigrants from South Central Asia (34.6%, a difference of 0.26%), Immigrants from Egypt (34.6%, a difference of 0.27%), and Thai (34.6%, a difference of 0.28%).
| Demographics | Rating | Rank | In Labor Force | Age 16-19 |
| Immigrants | Sri Lanka | 2.4 /100 | #246 | Tragic 34.9% |
| Laotians | 2.4 /100 | #247 | Tragic 34.9% |
| Central Americans | 2.2 /100 | #248 | Tragic 34.8% |
| Immigrants | Ukraine | 2.2 /100 | #249 | Tragic 34.8% |
| Immigrants | Pakistan | 2.0 /100 | #250 | Tragic 34.8% |
| Immigrants | Western Asia | 2.0 /100 | #251 | Tragic 34.8% |
| Immigrants | Chile | 2.0 /100 | #252 | Tragic 34.8% |
| Immigrants | Japan | 1.5 /100 | #253 | Tragic 34.7% |
| Bahamians | 1.4 /100 | #254 | Tragic 34.6% |
| Peruvians | 1.4 /100 | #255 | Tragic 34.6% |
| Immigrants | South Central Asia | 1.3 /100 | #256 | Tragic 34.6% |
| Immigrants | Egypt | 1.2 /100 | #257 | Tragic 34.6% |
| Thais | 1.2 /100 | #258 | Tragic 34.6% |
| Immigrants | Immigrants | 1.2 /100 | #259 | Tragic 34.6% |
| Egyptians | 1.2 /100 | #260 | Tragic 34.5% |
Demographics Similar to Hungarians by In Labor Force | Age 16-19
In terms of in labor force | age 16-19, the demographic groups most similar to Hungarians are French American Indian (39.8%, a difference of 0.020%), Immigrants from Middle Africa (39.9%, a difference of 0.23%), Iroquois (39.9%, a difference of 0.26%), Serbian (39.9%, a difference of 0.27%), and Malaysian (39.7%, a difference of 0.29%).
| Demographics | Rating | Rank | In Labor Force | Age 16-19 |
| Canadians | 100.0 /100 | #67 | Exceptional 40.1% |
| Italians | 99.9 /100 | #68 | Exceptional 40.1% |
| Potawatomi | 99.9 /100 | #69 | Exceptional 40.0% |
| Portuguese | 99.9 /100 | #70 | Exceptional 40.0% |
| Serbians | 99.9 /100 | #71 | Exceptional 39.9% |
| Iroquois | 99.9 /100 | #72 | Exceptional 39.9% |
| Immigrants | Middle Africa | 99.9 /100 | #73 | Exceptional 39.9% |
| Hungarians | 99.9 /100 | #74 | Exceptional 39.8% |
| French American Indians | 99.9 /100 | #75 | Exceptional 39.8% |
| Malaysians | 99.9 /100 | #76 | Exceptional 39.7% |
| Immigrants | Portugal | 99.9 /100 | #77 | Exceptional 39.7% |
| Austrians | 99.8 /100 | #78 | Exceptional 39.5% |
| Marshallese | 99.8 /100 | #79 | Exceptional 39.5% |
| Immigrants | Iraq | 99.8 /100 | #80 | Exceptional 39.4% |
| Shoshone | 99.7 /100 | #81 | Exceptional 39.3% |