Immigrants from North Macedonia vs Hungarian In Labor Force | Age 16-19

COMPARE

Immigrants from North Macedonia
Race
Ancestry
AfghanAfricanAlaska NativeAlaskan AthabascanAlbanianAleutAlsatianAmericanApacheArabArapahoArgentineanArmenianAssyrian/Chaldean/SyriacAustralianAustrianBahamianBangladeshiBarbadianBasqueBelgianBelizeanBermudanBhutaneseBlackfeetBolivianBrazilianBritishBritish West IndianBulgarianBurmeseCajunCambodianCanadianCape VerdeanCarpatho RusynCelticCentral AmericanCentral American IndianCherokeeCheyenneChickasawChileanChineseChippewaChoctawColombianColvilleComancheCosta RicanCreeCreekCroatianCrowCubanCypriotCzechCzechoslovakianDanishDelawareDominicanDutchDutch West IndianEastern EuropeanEcuadorianEgyptianEnglishEstonianEthiopianEuropeanFijianFilipinoFinnishFrenchFrench American IndianFrench CanadianGermanGerman RussianGhanaianGreekGuamanian/ChamorroGuatemalanGuyaneseHaitianHmongHonduranHopiHoumaIcelanderIndian (Asian)IndonesianInupiatIranianIraqiIrishIroquoisIsraeliItalianJamaicanJapaneseJordanianKenyanKiowaKoreanLaotianLatvianLebaneseLiberianLithuanianLumbeeLuxembourgerMacedonianMalaysianMalteseMarshalleseMenomineeMexicanMexican American IndianMongolianMoroccanNative HawaiianNavajoNepaleseNew ZealanderNicaraguanNigerianNorthern EuropeanNorwegianOkinawanOsageOttawaPaiutePakistaniPalestinianPanamanianParaguayanPennsylvania GermanPeruvianPimaPolishPortuguesePotawatomiPuebloPuerto RicanPuget Sound SalishRomanianRussianSalvadoranSamoanScandinavianScotch-IrishScottishSeminoleSenegaleseSerbianShoshoneSierra LeoneanSiouxSlavicSlovakSloveneSomaliSouth AfricanSouth AmericanSouth American IndianSoviet UnionSpaniardSpanishSpanish AmericanSpanish American IndianSri LankanSubsaharan AfricanSudaneseSwedishSwissSyrianTaiwaneseThaiTlingit-HaidaTohono O'OdhamTonganTrinidadian and TobagonianTsimshianTurkishU.S. Virgin IslanderUgandanUkrainianUruguayanUteVenezuelanVietnameseWelshWest IndianYakamaYaquiYugoslavianYumanYup'ikZimbabwean
Immigration
NonimmigrantsImmigrantsAfghanistanAfricaAlbaniaArgentinaArmeniaAsiaAustraliaAustriaBahamasBangladeshBarbadosBelarusBelgiumBelizeBoliviaBosnia and HerzegovinaBrazilBulgariaBurma/MyanmarCabo VerdeCambodiaCameroonCanadaCaribbeanCentral AmericaChileChinaColombiaCongoCosta RicaCroatiaCubaCzechoslovakiaDenmarkDominicaDominican RepublicEastern AfricaEastern AsiaEastern EuropeEcuadorEgyptEl SalvadorEnglandEritreaEthiopiaEuropeFijiFranceGermanyGhanaGreeceGrenadaGuatemalaGuyanaHaitiHondurasHong KongHungaryIndiaIndonesiaIranIraqIrelandIsraelItalyJamaicaJapanJordanKazakhstanKenyaKoreaKuwaitLaosLatin AmericaLatviaLebanonLiberiaLithuaniaMalaysiaMexicoMicronesiaMiddle AfricaMoldovaMoroccoNepalNetherlandsNicaraguaNigeriaNorth AmericaNorth MacedoniaNorthern AfricaNorthern EuropeNorwayOceaniaPakistanPanamaPeruPhilippinesPolandPortugalRomaniaRussiaSaudi ArabiaScotlandSenegalSerbiaSierra LeoneSingaporeSomaliaSouth AfricaSouth AmericaSouth Central AsiaSouth Eastern AsiaSouthern EuropeSpainSri LankaSt. Vincent and the GrenadinesSudanSwedenSwitzerlandSyriaTaiwanThailandTrinidad and TobagoTurkeyUgandaUkraineUruguayUzbekistanVenezuelaVietnamWest IndiesWestern AfricaWestern AsiaWestern EuropeYemenZaireZimbabweAzores
Hungarian
Race
Ancestry
AfghanAfricanAlaska NativeAlaskan AthabascanAlbanianAleutAlsatianAmericanApacheArabArapahoArgentineanArmenianAssyrian/Chaldean/SyriacAustralianAustrianBahamianBangladeshiBarbadianBasqueBelgianBelizeanBermudanBhutaneseBlackfeetBolivianBrazilianBritishBritish West IndianBulgarianBurmeseCajunCambodianCanadianCape VerdeanCarpatho RusynCelticCentral AmericanCentral American IndianCherokeeCheyenneChickasawChileanChineseChippewaChoctawColombianColvilleComancheCosta RicanCreeCreekCroatianCrowCubanCypriotCzechCzechoslovakianDanishDelawareDominicanDutchDutch West IndianEastern EuropeanEcuadorianEgyptianEnglishEstonianEthiopianEuropeanFijianFilipinoFinnishFrenchFrench American IndianFrench CanadianGermanGerman RussianGhanaianGreekGuamanian/ChamorroGuatemalanGuyaneseHaitianHmongHonduranHopiHoumaHungarianIcelanderIndian (Asian)IndonesianInupiatIranianIraqiIrishIroquoisIsraeliItalianJamaicanJapaneseJordanianKenyanKiowaKoreanLaotianLatvianLebaneseLiberianLithuanianLumbeeLuxembourgerMacedonianMalaysianMalteseMarshalleseMenomineeMexicanMexican American IndianMongolianMoroccanNative HawaiianNavajoNepaleseNew ZealanderNicaraguanNigerianNorthern EuropeanNorwegianOkinawanOsageOttawaPaiutePakistaniPalestinianPanamanianParaguayanPennsylvania GermanPeruvianPimaPolishPortuguesePotawatomiPuebloPuerto RicanPuget Sound SalishRomanianRussianSalvadoranSamoanScandinavianScotch-IrishScottishSeminoleSenegaleseSerbianShoshoneSierra LeoneanSiouxSlavicSlovakSloveneSomaliSouth AfricanSouth AmericanSouth American IndianSoviet UnionSpaniardSpanishSpanish AmericanSpanish American IndianSri LankanSubsaharan AfricanSudaneseSwedishSwissSyrianTaiwaneseThaiTlingit-HaidaTohono O'OdhamTonganTrinidadian and TobagonianTsimshianTurkishU.S. Virgin IslanderUgandanUkrainianUruguayanUteVenezuelanVietnameseWelshWest IndianYakamaYaquiYugoslavianYumanYup'ikZimbabwean
Immigration
NonimmigrantsImmigrantsAfghanistanAfricaAlbaniaArgentinaArmeniaAsiaAustraliaAustriaBahamasBangladeshBarbadosBelarusBelgiumBelizeBoliviaBosnia and HerzegovinaBrazilBulgariaBurma/MyanmarCabo VerdeCambodiaCameroonCanadaCaribbeanCentral AmericaChileChinaColombiaCongoCosta RicaCroatiaCubaCzechoslovakiaDenmarkDominicaDominican RepublicEastern AfricaEastern AsiaEastern EuropeEcuadorEgyptEl SalvadorEnglandEritreaEthiopiaEuropeFijiFranceGermanyGhanaGreeceGrenadaGuatemalaGuyanaHaitiHondurasHong KongHungaryIndiaIndonesiaIranIraqIrelandIsraelItalyJamaicaJapanJordanKazakhstanKenyaKoreaKuwaitLaosLatin AmericaLatviaLebanonLiberiaLithuaniaMalaysiaMexicoMicronesiaMiddle AfricaMoldovaMoroccoNepalNetherlandsNicaraguaNigeriaNorth AmericaNorthern AfricaNorthern EuropeNorwayOceaniaPakistanPanamaPeruPhilippinesPolandPortugalRomaniaRussiaSaudi ArabiaScotlandSenegalSerbiaSierra LeoneSingaporeSomaliaSouth AfricaSouth AmericaSouth Central AsiaSouth Eastern AsiaSouthern EuropeSpainSri LankaSt. Vincent and the GrenadinesSudanSwedenSwitzerlandSyriaTaiwanThailandTrinidad and TobagoTurkeyUgandaUkraineUruguayUzbekistanVenezuelaVietnamWest IndiesWestern AfricaWestern AsiaWestern EuropeYemenZaireZimbabweAzores
In Labor Force | Age 16-19
Income
Poverty
Unemployment
Labor Participation
Family Structure
Vehicle Availability
Education Level
Disability

In Labor Force | Age 16-19 Comparison

Immigrants from North Macedonia

Hungarians

Exceptional
Exceptional
38.9%
IN LABOR FORCE | AGE 16-19
99.3/ 100
METRIC RATING
99th/ 347
METRIC RANK
39.8%
IN LABOR FORCE | AGE 16-19
99.9/ 100
METRIC RATING
74th/ 347
METRIC RANK

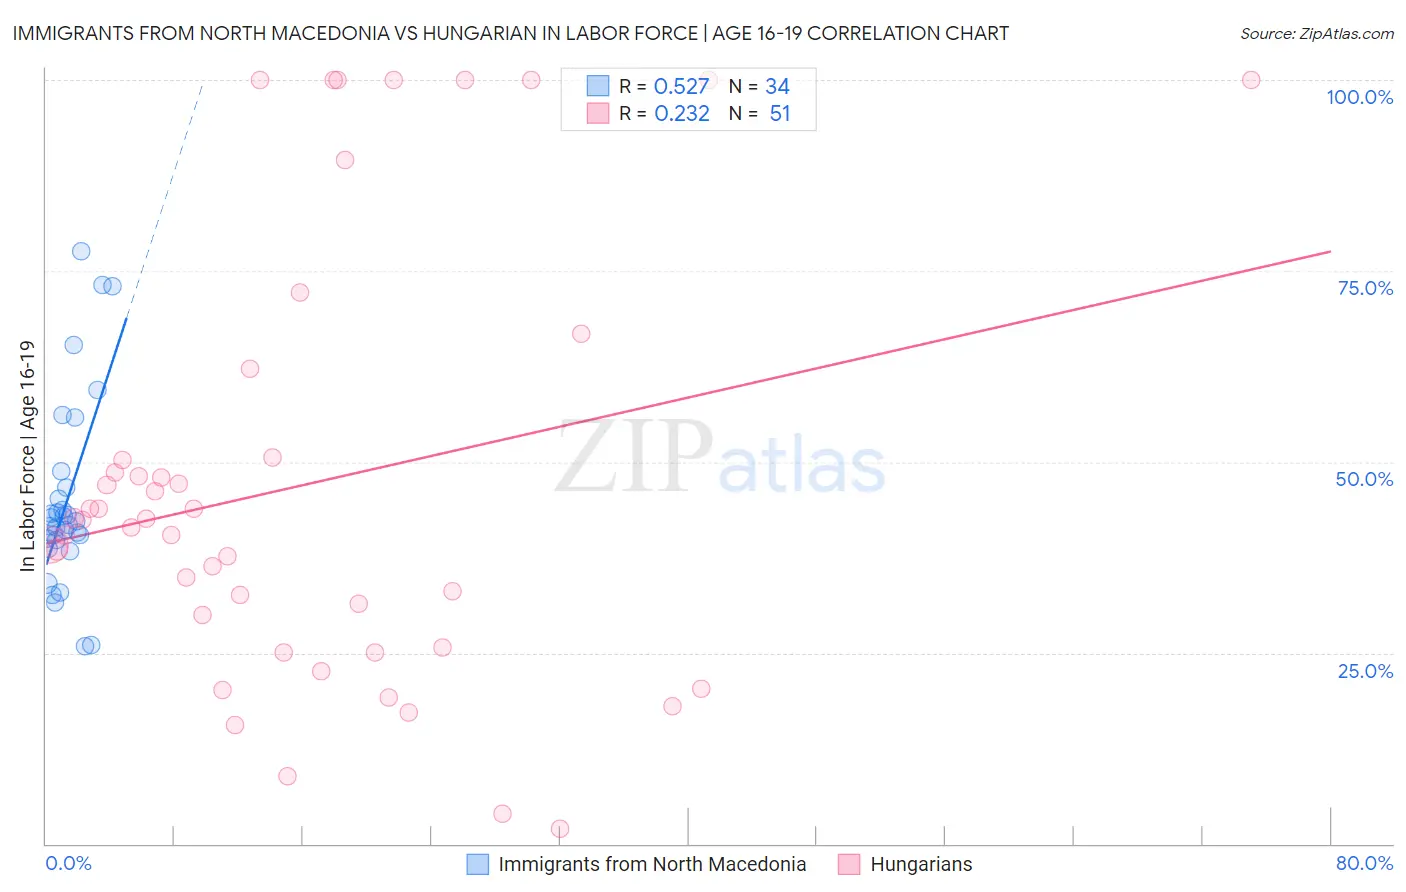
Immigrants from North Macedonia vs Hungarian In Labor Force | Age 16-19 Correlation Chart

The statistical analysis conducted on geographies consisting of 74,262,337 people shows a substantial positive correlation between the proportion of Immigrants from North Macedonia and labor force participation rate among population between the ages 16 and 19 in the United States with a correlation coefficient (R) of 0.527 and weighted average of 38.9%. Similarly, the statistical analysis conducted on geographies consisting of 484,680,746 people shows a weak positive correlation between the proportion of Hungarians and labor force participation rate among population between the ages 16 and 19 in the United States with a correlation coefficient (R) of 0.232 and weighted average of 39.8%, a difference of 2.5%.
Immigrants from North Macedonia vs Hungarian In Labor Force | Age 16-19

In Labor Force | Age 16-19 Correlation Summary

MeasurementImmigrants from North MacedoniaHungarian
Minimum25.9%2.0%
Maximum77.6%100.0%
Range51.7%98.0%
Mean45.0%47.0%
Median42.0%42.4%
Interquartile 25% (IQ1)39.8%25.7%
Interquartile 75% (IQ3)46.7%50.5%
Interquartile Range (IQR)7.0%24.8%
Standard Deviation (Sample)12.5%28.1%
Standard Deviation (Population)12.3%27.8%

Similar Demographics by In Labor Force | Age 16-19

Demographics Similar to Immigrants from North Macedonia by In Labor Force | Age 16-19

In terms of in labor force | age 16-19, the demographic groups most similar to Immigrants from North Macedonia are Ugandan (38.9%, a difference of 0.020%), Greek (38.9%, a difference of 0.030%), Latvian (38.9%, a difference of 0.070%), Immigrants from North America (38.9%, a difference of 0.10%), and Blackfeet (38.9%, a difference of 0.19%).
DemographicsRating | RankIn Labor Force | Age 16-19
Osage
99.4
/100
|
#92
Exceptional
39.0%
Blackfeet
99.4
/100
|
#93
Exceptional
38.9%
Immigrants | Canada
99.4
/100
|
#94
Exceptional
38.9%
Immigrants | North America
99.4
/100
|
#95
Exceptional
38.9%
Latvians
99.4
/100
|
#96
Exceptional
38.9%
Greeks
99.3
/100
|
#97
Exceptional
38.9%
Ugandans
99.3
/100
|
#98
Exceptional
38.9%
Immigrants | North Macedonia
99.3
/100
|
#99
Exceptional
38.9%
Immigrants | Thailand
99.1
/100
|
#100
Exceptional
38.7%
Hmong
99.1
/100
|
#101
Exceptional
38.7%
Zimbabweans
99.1
/100
|
#102
Exceptional
38.7%
Immigrants | Cameroon
99.0
/100
|
#103
Exceptional
38.7%
Immigrants | Eritrea
99.0
/100
|
#104
Exceptional
38.7%
Iraqis
98.9
/100
|
#105
Exceptional
38.6%
Delaware
98.8
/100
|
#106
Exceptional
38.6%

Demographics Similar to Hungarians by In Labor Force | Age 16-19

In terms of in labor force | age 16-19, the demographic groups most similar to Hungarians are French American Indian (39.8%, a difference of 0.020%), Immigrants from Middle Africa (39.9%, a difference of 0.23%), Iroquois (39.9%, a difference of 0.26%), Serbian (39.9%, a difference of 0.27%), and Malaysian (39.7%, a difference of 0.29%).
DemographicsRating | RankIn Labor Force | Age 16-19
Canadians
100.0
/100
|
#67
Exceptional
40.1%
Italians
99.9
/100
|
#68
Exceptional
40.1%
Potawatomi
99.9
/100
|
#69
Exceptional
40.0%
Portuguese
99.9
/100
|
#70
Exceptional
40.0%
Serbians
99.9
/100
|
#71
Exceptional
39.9%
Iroquois
99.9
/100
|
#72
Exceptional
39.9%
Immigrants | Middle Africa
99.9
/100
|
#73
Exceptional
39.9%
Hungarians
99.9
/100
|
#74
Exceptional
39.8%
French American Indians
99.9
/100
|
#75
Exceptional
39.8%
Malaysians
99.9
/100
|
#76
Exceptional
39.7%
Immigrants | Portugal
99.9
/100
|
#77
Exceptional
39.7%
Austrians
99.8
/100
|
#78
Exceptional
39.5%
Marshallese
99.8
/100
|
#79
Exceptional
39.5%
Immigrants | Iraq
99.8
/100
|
#80
Exceptional
39.4%
Shoshone
99.7
/100
|
#81
Exceptional
39.3%