Immigrants from South Central Asia vs Bangladeshi In Labor Force | Age 16-19
COMPARE
Immigrants from South Central Asia
Bangladeshi
In Labor Force | Age 16-19
In Labor Force | Age 16-19 Comparison
Immigrants from South Central Asia
Bangladeshis
34.6%
IN LABOR FORCE | AGE 16-19
1.3/ 100
METRIC RATING
256th/ 347
METRIC RANK
42.5%
IN LABOR FORCE | AGE 16-19
100.0/ 100
METRIC RATING
24th/ 347
METRIC RANK
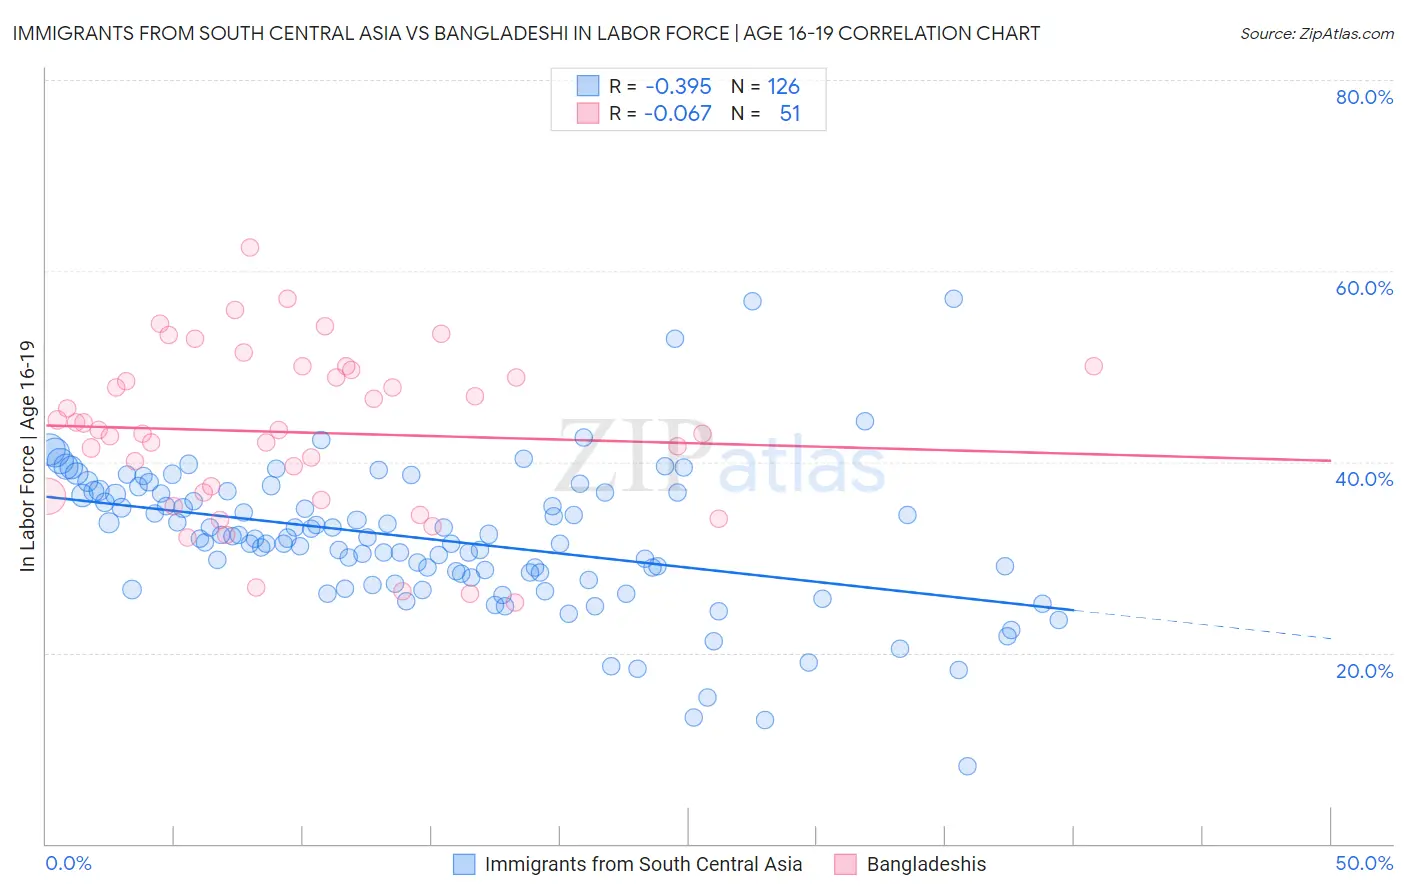
Immigrants from South Central Asia vs Bangladeshi In Labor Force | Age 16-19 Correlation Chart
The statistical analysis conducted on geographies consisting of 472,115,332 people shows a mild negative correlation between the proportion of Immigrants from South Central Asia and labor force participation rate among population between the ages 16 and 19 in the United States with a correlation coefficient (R) of -0.395 and weighted average of 34.6%. Similarly, the statistical analysis conducted on geographies consisting of 141,415,826 people shows a slight negative correlation between the proportion of Bangladeshis and labor force participation rate among population between the ages 16 and 19 in the United States with a correlation coefficient (R) of -0.067 and weighted average of 42.5%, a difference of 22.9%.
In Labor Force | Age 16-19 Correlation Summary
| Measurement | Immigrants from South Central Asia | Bangladeshi |
| Minimum | 8.1% | 25.3% |
| Maximum | 57.1% | 62.5% |
| Range | 49.0% | 37.2% |
| Mean | 31.9% | 43.1% |
| Median | 32.0% | 43.3% |
| Interquartile 25% (IQ1) | 27.9% | 36.4% |
| Interquartile 75% (IQ3) | 36.8% | 49.6% |
| Interquartile Range (IQR) | 8.9% | 13.2% |
| Standard Deviation (Sample) | 7.5% | 8.6% |
| Standard Deviation (Population) | 7.5% | 8.5% |
Similar Demographics by In Labor Force | Age 16-19
Demographics Similar to Immigrants from South Central Asia by In Labor Force | Age 16-19
In terms of in labor force | age 16-19, the demographic groups most similar to Immigrants from South Central Asia are Immigrants from Egypt (34.6%, a difference of 0.010%), Thai (34.6%, a difference of 0.010%), Immigrants (34.6%, a difference of 0.030%), Peruvian (34.6%, a difference of 0.11%), and Egyptian (34.5%, a difference of 0.11%).
| Demographics | Rating | Rank | In Labor Force | Age 16-19 |
| Immigrants | Ukraine | 2.2 /100 | #249 | Tragic 34.8% |
| Immigrants | Pakistan | 2.0 /100 | #250 | Tragic 34.8% |
| Immigrants | Western Asia | 2.0 /100 | #251 | Tragic 34.8% |
| Immigrants | Chile | 2.0 /100 | #252 | Tragic 34.8% |
| Immigrants | Japan | 1.5 /100 | #253 | Tragic 34.7% |
| Bahamians | 1.4 /100 | #254 | Tragic 34.6% |
| Peruvians | 1.4 /100 | #255 | Tragic 34.6% |
| Immigrants | South Central Asia | 1.3 /100 | #256 | Tragic 34.6% |
| Immigrants | Egypt | 1.2 /100 | #257 | Tragic 34.6% |
| Thais | 1.2 /100 | #258 | Tragic 34.6% |
| Immigrants | Immigrants | 1.2 /100 | #259 | Tragic 34.6% |
| Egyptians | 1.2 /100 | #260 | Tragic 34.5% |
| Salvadorans | 1.1 /100 | #261 | Tragic 34.5% |
| Hispanics or Latinos | 1.1 /100 | #262 | Tragic 34.5% |
| Burmese | 1.1 /100 | #263 | Tragic 34.5% |
Demographics Similar to Bangladeshis by In Labor Force | Age 16-19
In terms of in labor force | age 16-19, the demographic groups most similar to Bangladeshis are German Russian (42.4%, a difference of 0.080%), English (42.4%, a difference of 0.21%), Slovak (42.6%, a difference of 0.33%), Welsh (42.3%, a difference of 0.48%), and Polish (42.1%, a difference of 0.78%).
| Demographics | Rating | Rank | In Labor Force | Age 16-19 |
| Scandinavians | 100.0 /100 | #17 | Exceptional 43.6% |
| French Canadians | 100.0 /100 | #18 | Exceptional 43.6% |
| Belgians | 100.0 /100 | #19 | Exceptional 43.4% |
| Swiss | 100.0 /100 | #20 | Exceptional 43.3% |
| Ottawa | 100.0 /100 | #21 | Exceptional 43.0% |
| Sudanese | 100.0 /100 | #22 | Exceptional 42.9% |
| Slovaks | 100.0 /100 | #23 | Exceptional 42.6% |
| Bangladeshis | 100.0 /100 | #24 | Exceptional 42.5% |
| German Russians | 100.0 /100 | #25 | Exceptional 42.4% |
| English | 100.0 /100 | #26 | Exceptional 42.4% |
| Welsh | 100.0 /100 | #27 | Exceptional 42.3% |
| Poles | 100.0 /100 | #28 | Exceptional 42.1% |
| French | 100.0 /100 | #29 | Exceptional 42.1% |
| Scottish | 100.0 /100 | #30 | Exceptional 42.0% |
| Irish | 100.0 /100 | #31 | Exceptional 42.0% |