Immigrants from Cabo Verde vs Bangladeshi In Labor Force | Age 16-19
COMPARE
Immigrants from Cabo Verde
Bangladeshi
In Labor Force | Age 16-19
In Labor Force | Age 16-19 Comparison
Immigrants from Cabo Verde
Bangladeshis
44.7%
IN LABOR FORCE | AGE 16-19
100.0/ 100
METRIC RATING
8th/ 347
METRIC RANK
42.5%
IN LABOR FORCE | AGE 16-19
100.0/ 100
METRIC RATING
24th/ 347
METRIC RANK
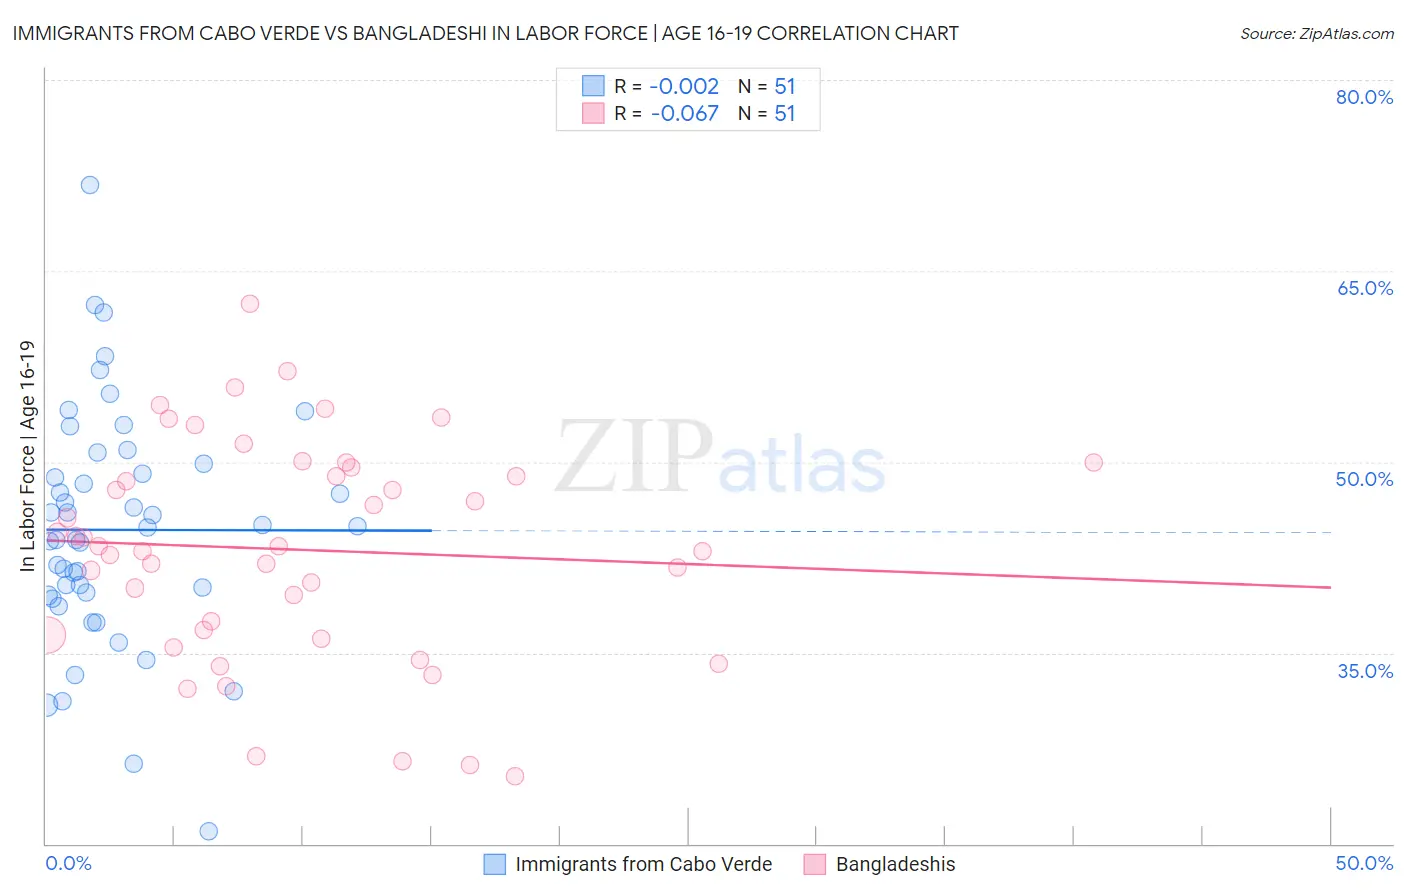
Immigrants from Cabo Verde vs Bangladeshi In Labor Force | Age 16-19 Correlation Chart
The statistical analysis conducted on geographies consisting of 38,150,273 people shows no correlation between the proportion of Immigrants from Cabo Verde and labor force participation rate among population between the ages 16 and 19 in the United States with a correlation coefficient (R) of -0.002 and weighted average of 44.7%. Similarly, the statistical analysis conducted on geographies consisting of 141,415,826 people shows a slight negative correlation between the proportion of Bangladeshis and labor force participation rate among population between the ages 16 and 19 in the United States with a correlation coefficient (R) of -0.067 and weighted average of 42.5%, a difference of 5.2%.
In Labor Force | Age 16-19 Correlation Summary
| Measurement | Immigrants from Cabo Verde | Bangladeshi |
| Minimum | 21.0% | 25.3% |
| Maximum | 71.8% | 62.5% |
| Range | 50.8% | 37.2% |
| Mean | 44.7% | 43.1% |
| Median | 44.8% | 43.3% |
| Interquartile 25% (IQ1) | 39.5% | 36.4% |
| Interquartile 75% (IQ3) | 49.9% | 49.6% |
| Interquartile Range (IQR) | 10.4% | 13.2% |
| Standard Deviation (Sample) | 9.3% | 8.6% |
| Standard Deviation (Population) | 9.2% | 8.5% |
Demographics Similar to Immigrants from Cabo Verde and Bangladeshis by In Labor Force | Age 16-19
In terms of in labor force | age 16-19, the demographic groups most similar to Immigrants from Cabo Verde are Danish (44.7%, a difference of 0.040%), Cape Verdean (44.5%, a difference of 0.42%), Somali (45.1%, a difference of 0.99%), German (44.2%, a difference of 1.2%), and Swedish (44.1%, a difference of 1.3%). Similarly, the demographic groups most similar to Bangladeshis are German Russian (42.4%, a difference of 0.080%), English (42.4%, a difference of 0.21%), Slovak (42.6%, a difference of 0.33%), Sudanese (42.9%, a difference of 0.92%), and Ottawa (43.0%, a difference of 1.3%).
| Demographics | Rating | Rank | In Labor Force | Age 16-19 |
| Somalis | 100.0 /100 | #6 | Exceptional 45.1% |
| Danes | 100.0 /100 | #7 | Exceptional 44.7% |
| Immigrants | Cabo Verde | 100.0 /100 | #8 | Exceptional 44.7% |
| Cape Verdeans | 100.0 /100 | #9 | Exceptional 44.5% |
| Germans | 100.0 /100 | #10 | Exceptional 44.2% |
| Swedes | 100.0 /100 | #11 | Exceptional 44.1% |
| Finns | 100.0 /100 | #12 | Exceptional 43.9% |
| Dutch | 100.0 /100 | #13 | Exceptional 43.8% |
| Chippewa | 100.0 /100 | #14 | Exceptional 43.8% |
| Slovenes | 100.0 /100 | #15 | Exceptional 43.7% |
| Czechs | 100.0 /100 | #16 | Exceptional 43.6% |
| Scandinavians | 100.0 /100 | #17 | Exceptional 43.6% |
| French Canadians | 100.0 /100 | #18 | Exceptional 43.6% |
| Belgians | 100.0 /100 | #19 | Exceptional 43.4% |
| Swiss | 100.0 /100 | #20 | Exceptional 43.3% |
| Ottawa | 100.0 /100 | #21 | Exceptional 43.0% |
| Sudanese | 100.0 /100 | #22 | Exceptional 42.9% |
| Slovaks | 100.0 /100 | #23 | Exceptional 42.6% |
| Bangladeshis | 100.0 /100 | #24 | Exceptional 42.5% |
| German Russians | 100.0 /100 | #25 | Exceptional 42.4% |
| English | 100.0 /100 | #26 | Exceptional 42.4% |