Liberian vs Danish In Labor Force | Age 16-19
COMPARE
Liberian
Danish
In Labor Force | Age 16-19
In Labor Force | Age 16-19 Comparison
Liberians
Danes
41.8%
IN LABOR FORCE | AGE 16-19
100.0/ 100
METRIC RATING
33rd/ 347
METRIC RANK
44.7%
IN LABOR FORCE | AGE 16-19
100.0/ 100
METRIC RATING
7th/ 347
METRIC RANK
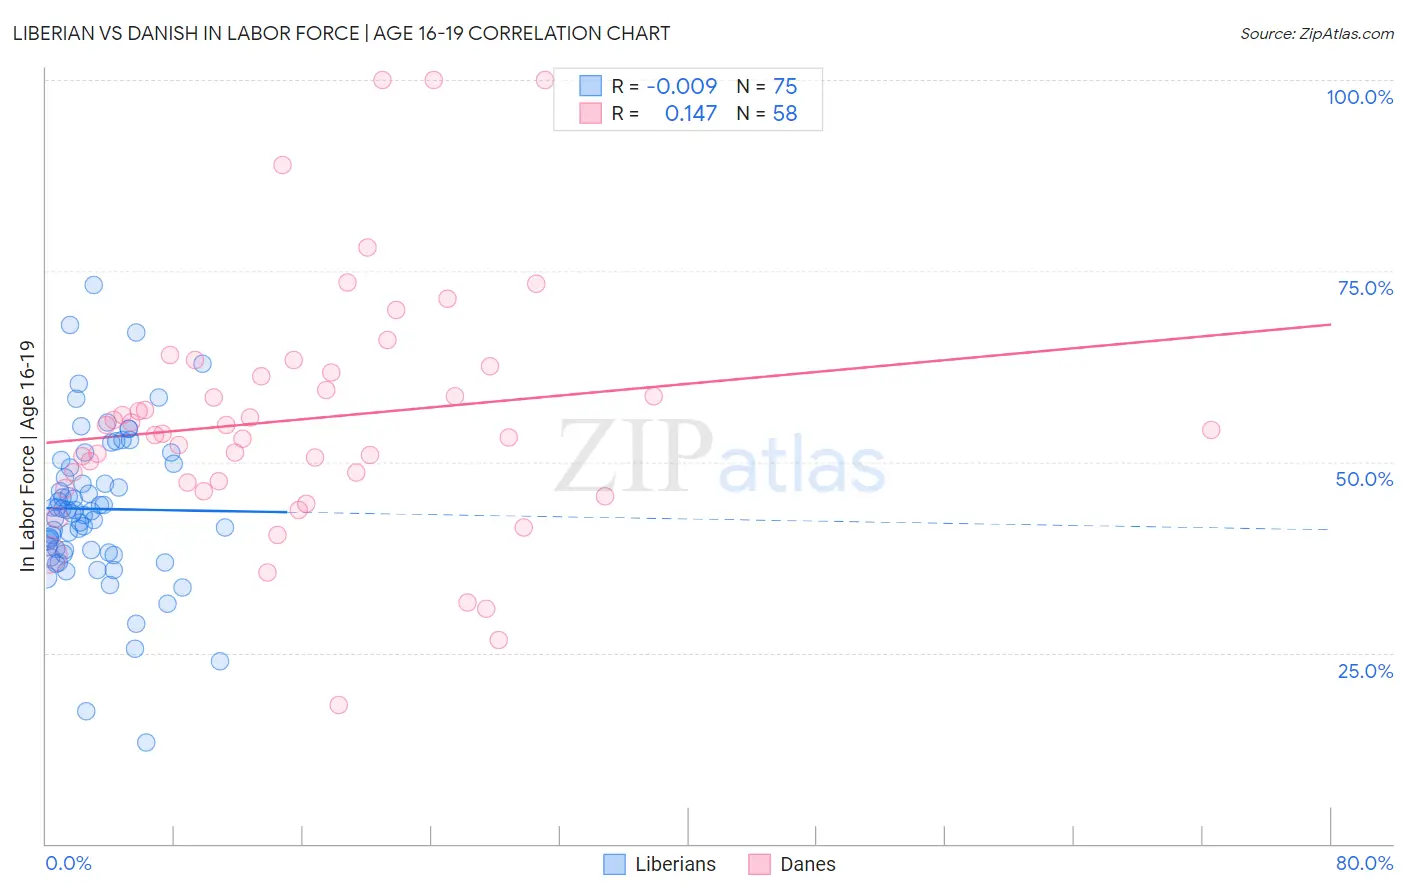
Liberian vs Danish In Labor Force | Age 16-19 Correlation Chart
The statistical analysis conducted on geographies consisting of 118,043,007 people shows no correlation between the proportion of Liberians and labor force participation rate among population between the ages 16 and 19 in the United States with a correlation coefficient (R) of -0.009 and weighted average of 41.8%. Similarly, the statistical analysis conducted on geographies consisting of 472,554,362 people shows a poor positive correlation between the proportion of Danes and labor force participation rate among population between the ages 16 and 19 in the United States with a correlation coefficient (R) of 0.147 and weighted average of 44.7%, a difference of 6.9%.
In Labor Force | Age 16-19 Correlation Summary
| Measurement | Liberian | Danish |
| Minimum | 13.3% | 18.2% |
| Maximum | 73.2% | 100.0% |
| Range | 59.9% | 81.8% |
| Mean | 43.8% | 55.6% |
| Median | 43.6% | 53.9% |
| Interquartile 25% (IQ1) | 38.1% | 47.3% |
| Interquartile 75% (IQ3) | 49.7% | 61.7% |
| Interquartile Range (IQR) | 11.6% | 14.4% |
| Standard Deviation (Sample) | 10.3% | 16.1% |
| Standard Deviation (Population) | 10.2% | 16.0% |
Similar Demographics by In Labor Force | Age 16-19
Demographics Similar to Liberians by In Labor Force | Age 16-19
In terms of in labor force | age 16-19, the demographic groups most similar to Liberians are Immigrants from Bosnia and Herzegovina (41.8%, a difference of 0.080%), Yugoslavian (41.8%, a difference of 0.10%), Czechoslovakian (41.9%, a difference of 0.14%), Immigrants from the Azores (41.7%, a difference of 0.24%), and Immigrants from Congo (41.7%, a difference of 0.32%).
| Demographics | Rating | Rank | In Labor Force | Age 16-19 |
| English | 100.0 /100 | #26 | Exceptional 42.4% |
| Welsh | 100.0 /100 | #27 | Exceptional 42.3% |
| Poles | 100.0 /100 | #28 | Exceptional 42.1% |
| French | 100.0 /100 | #29 | Exceptional 42.1% |
| Scottish | 100.0 /100 | #30 | Exceptional 42.0% |
| Irish | 100.0 /100 | #31 | Exceptional 42.0% |
| Czechoslovakians | 100.0 /100 | #32 | Exceptional 41.9% |
| Liberians | 100.0 /100 | #33 | Exceptional 41.8% |
| Immigrants | Bosnia and Herzegovina | 100.0 /100 | #34 | Exceptional 41.8% |
| Yugoslavians | 100.0 /100 | #35 | Exceptional 41.8% |
| Immigrants | Azores | 100.0 /100 | #36 | Exceptional 41.7% |
| Immigrants | Congo | 100.0 /100 | #37 | Exceptional 41.7% |
| Sioux | 100.0 /100 | #38 | Exceptional 41.5% |
| Scotch-Irish | 100.0 /100 | #39 | Exceptional 41.5% |
| Immigrants | Liberia | 100.0 /100 | #40 | Exceptional 41.5% |
Demographics Similar to Danes by In Labor Force | Age 16-19
In terms of in labor force | age 16-19, the demographic groups most similar to Danes are Immigrants from Cabo Verde (44.7%, a difference of 0.040%), Cape Verdean (44.5%, a difference of 0.46%), Somali (45.1%, a difference of 0.95%), Alaskan Athabascan (45.2%, a difference of 1.1%), and German (44.2%, a difference of 1.2%).
| Demographics | Rating | Rank | In Labor Force | Age 16-19 |
| Pennsylvania Germans | 100.0 /100 | #1 | Exceptional 46.4% |
| Norwegians | 100.0 /100 | #2 | Exceptional 46.2% |
| Immigrants | Somalia | 100.0 /100 | #3 | Exceptional 45.6% |
| Luxembourgers | 100.0 /100 | #4 | Exceptional 45.3% |
| Alaskan Athabascans | 100.0 /100 | #5 | Exceptional 45.2% |
| Somalis | 100.0 /100 | #6 | Exceptional 45.1% |
| Danes | 100.0 /100 | #7 | Exceptional 44.7% |
| Immigrants | Cabo Verde | 100.0 /100 | #8 | Exceptional 44.7% |
| Cape Verdeans | 100.0 /100 | #9 | Exceptional 44.5% |
| Germans | 100.0 /100 | #10 | Exceptional 44.2% |
| Swedes | 100.0 /100 | #11 | Exceptional 44.1% |
| Finns | 100.0 /100 | #12 | Exceptional 43.9% |
| Dutch | 100.0 /100 | #13 | Exceptional 43.8% |
| Chippewa | 100.0 /100 | #14 | Exceptional 43.8% |
| Slovenes | 100.0 /100 | #15 | Exceptional 43.7% |