Liberian vs Dutch In Labor Force | Age 16-19
COMPARE
Liberian
Dutch
In Labor Force | Age 16-19
In Labor Force | Age 16-19 Comparison
Liberians
Dutch
41.8%
IN LABOR FORCE | AGE 16-19
100.0/ 100
METRIC RATING
33rd/ 347
METRIC RANK
43.8%
IN LABOR FORCE | AGE 16-19
100.0/ 100
METRIC RATING
13th/ 347
METRIC RANK
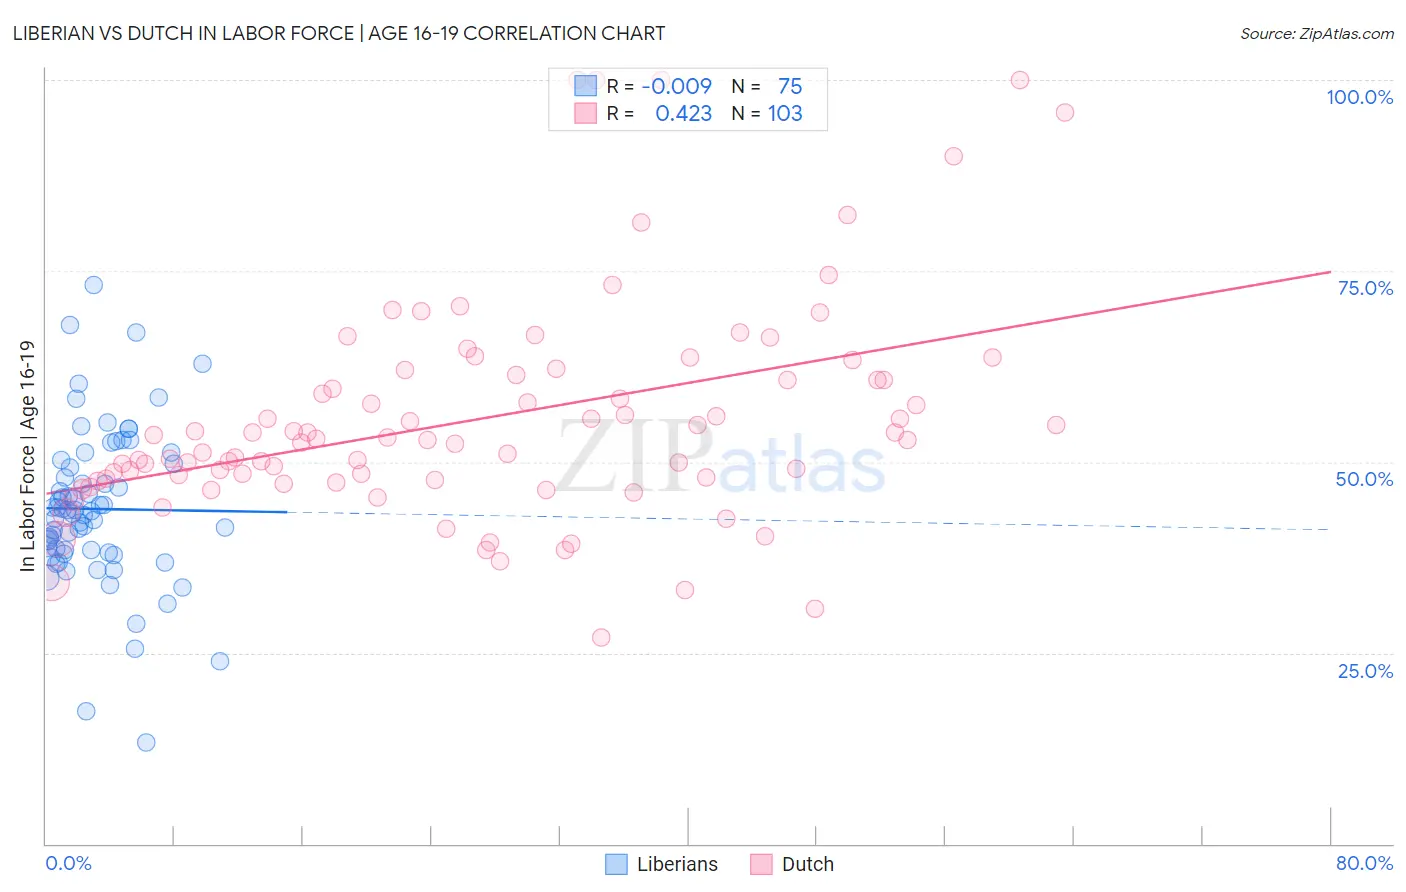
Liberian vs Dutch In Labor Force | Age 16-19 Correlation Chart
The statistical analysis conducted on geographies consisting of 118,043,007 people shows no correlation between the proportion of Liberians and labor force participation rate among population between the ages 16 and 19 in the United States with a correlation coefficient (R) of -0.009 and weighted average of 41.8%. Similarly, the statistical analysis conducted on geographies consisting of 550,994,528 people shows a moderate positive correlation between the proportion of Dutch and labor force participation rate among population between the ages 16 and 19 in the United States with a correlation coefficient (R) of 0.423 and weighted average of 43.8%, a difference of 4.8%.
In Labor Force | Age 16-19 Correlation Summary
| Measurement | Liberian | Dutch |
| Minimum | 13.3% | 27.0% |
| Maximum | 73.2% | 100.0% |
| Range | 59.9% | 73.0% |
| Mean | 43.8% | 55.7% |
| Median | 43.6% | 52.9% |
| Interquartile 25% (IQ1) | 38.1% | 47.7% |
| Interquartile 75% (IQ3) | 49.7% | 61.4% |
| Interquartile Range (IQR) | 11.6% | 13.7% |
| Standard Deviation (Sample) | 10.3% | 14.5% |
| Standard Deviation (Population) | 10.2% | 14.4% |
Demographics Similar to Liberians and Dutch by In Labor Force | Age 16-19
In terms of in labor force | age 16-19, the demographic groups most similar to Liberians are Czechoslovakian (41.9%, a difference of 0.14%), Irish (42.0%, a difference of 0.34%), Scottish (42.0%, a difference of 0.41%), French (42.1%, a difference of 0.69%), and Polish (42.1%, a difference of 0.74%). Similarly, the demographic groups most similar to Dutch are Chippewa (43.8%, a difference of 0.10%), Slovene (43.7%, a difference of 0.36%), Czech (43.6%, a difference of 0.47%), Scandinavian (43.6%, a difference of 0.53%), and French Canadian (43.6%, a difference of 0.61%).
| Demographics | Rating | Rank | In Labor Force | Age 16-19 |
| Dutch | 100.0 /100 | #13 | Exceptional 43.8% |
| Chippewa | 100.0 /100 | #14 | Exceptional 43.8% |
| Slovenes | 100.0 /100 | #15 | Exceptional 43.7% |
| Czechs | 100.0 /100 | #16 | Exceptional 43.6% |
| Scandinavians | 100.0 /100 | #17 | Exceptional 43.6% |
| French Canadians | 100.0 /100 | #18 | Exceptional 43.6% |
| Belgians | 100.0 /100 | #19 | Exceptional 43.4% |
| Swiss | 100.0 /100 | #20 | Exceptional 43.3% |
| Ottawa | 100.0 /100 | #21 | Exceptional 43.0% |
| Sudanese | 100.0 /100 | #22 | Exceptional 42.9% |
| Slovaks | 100.0 /100 | #23 | Exceptional 42.6% |
| Bangladeshis | 100.0 /100 | #24 | Exceptional 42.5% |
| German Russians | 100.0 /100 | #25 | Exceptional 42.4% |
| English | 100.0 /100 | #26 | Exceptional 42.4% |
| Welsh | 100.0 /100 | #27 | Exceptional 42.3% |
| Poles | 100.0 /100 | #28 | Exceptional 42.1% |
| French | 100.0 /100 | #29 | Exceptional 42.1% |
| Scottish | 100.0 /100 | #30 | Exceptional 42.0% |
| Irish | 100.0 /100 | #31 | Exceptional 42.0% |
| Czechoslovakians | 100.0 /100 | #32 | Exceptional 41.9% |
| Liberians | 100.0 /100 | #33 | Exceptional 41.8% |