Liberian vs Cambodian In Labor Force | Age 16-19
COMPARE
Liberian
Cambodian
In Labor Force | Age 16-19
In Labor Force | Age 16-19 Comparison
Liberians
Cambodians
41.8%
IN LABOR FORCE | AGE 16-19
100.0/ 100
METRIC RATING
33rd/ 347
METRIC RANK
37.0%
IN LABOR FORCE | AGE 16-19
71.5/ 100
METRIC RATING
161st/ 347
METRIC RANK
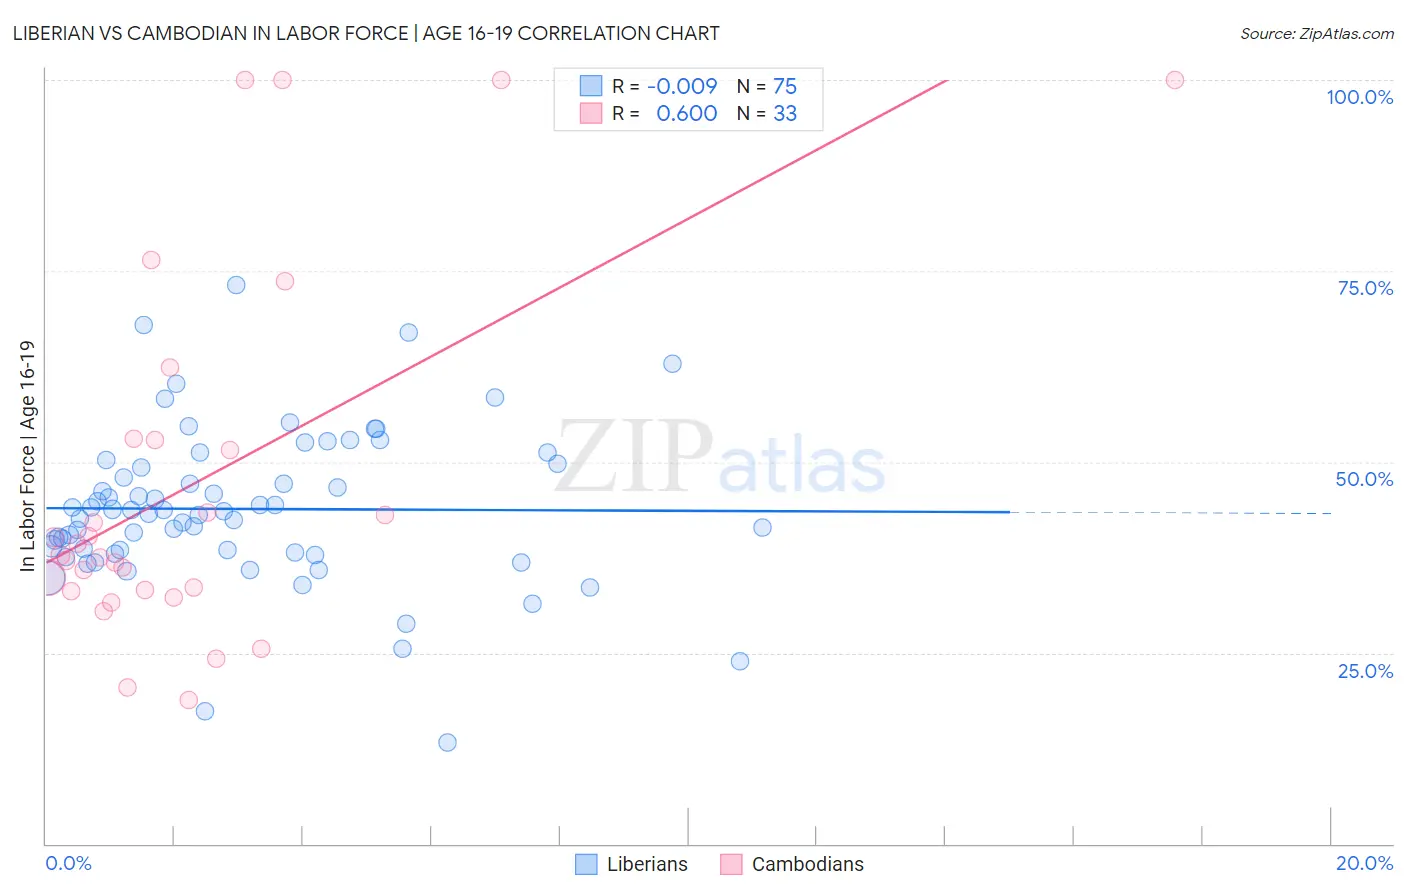
Liberian vs Cambodian In Labor Force | Age 16-19 Correlation Chart
The statistical analysis conducted on geographies consisting of 118,043,007 people shows no correlation between the proportion of Liberians and labor force participation rate among population between the ages 16 and 19 in the United States with a correlation coefficient (R) of -0.009 and weighted average of 41.8%. Similarly, the statistical analysis conducted on geographies consisting of 102,494,767 people shows a significant positive correlation between the proportion of Cambodians and labor force participation rate among population between the ages 16 and 19 in the United States with a correlation coefficient (R) of 0.600 and weighted average of 37.0%, a difference of 13.1%.
In Labor Force | Age 16-19 Correlation Summary
| Measurement | Liberian | Cambodian |
| Minimum | 13.3% | 18.8% |
| Maximum | 73.2% | 100.0% |
| Range | 59.9% | 81.2% |
| Mean | 43.8% | 47.2% |
| Median | 43.6% | 37.7% |
| Interquartile 25% (IQ1) | 38.1% | 33.2% |
| Interquartile 75% (IQ3) | 49.7% | 53.0% |
| Interquartile Range (IQR) | 11.6% | 19.8% |
| Standard Deviation (Sample) | 10.3% | 23.6% |
| Standard Deviation (Population) | 10.2% | 23.3% |
Similar Demographics by In Labor Force | Age 16-19
Demographics Similar to Liberians by In Labor Force | Age 16-19
In terms of in labor force | age 16-19, the demographic groups most similar to Liberians are Immigrants from Bosnia and Herzegovina (41.8%, a difference of 0.080%), Yugoslavian (41.8%, a difference of 0.10%), Czechoslovakian (41.9%, a difference of 0.14%), Immigrants from the Azores (41.7%, a difference of 0.24%), and Immigrants from Congo (41.7%, a difference of 0.32%).
| Demographics | Rating | Rank | In Labor Force | Age 16-19 |
| English | 100.0 /100 | #26 | Exceptional 42.4% |
| Welsh | 100.0 /100 | #27 | Exceptional 42.3% |
| Poles | 100.0 /100 | #28 | Exceptional 42.1% |
| French | 100.0 /100 | #29 | Exceptional 42.1% |
| Scottish | 100.0 /100 | #30 | Exceptional 42.0% |
| Irish | 100.0 /100 | #31 | Exceptional 42.0% |
| Czechoslovakians | 100.0 /100 | #32 | Exceptional 41.9% |
| Liberians | 100.0 /100 | #33 | Exceptional 41.8% |
| Immigrants | Bosnia and Herzegovina | 100.0 /100 | #34 | Exceptional 41.8% |
| Yugoslavians | 100.0 /100 | #35 | Exceptional 41.8% |
| Immigrants | Azores | 100.0 /100 | #36 | Exceptional 41.7% |
| Immigrants | Congo | 100.0 /100 | #37 | Exceptional 41.7% |
| Sioux | 100.0 /100 | #38 | Exceptional 41.5% |
| Scotch-Irish | 100.0 /100 | #39 | Exceptional 41.5% |
| Immigrants | Liberia | 100.0 /100 | #40 | Exceptional 41.5% |
Demographics Similar to Cambodians by In Labor Force | Age 16-19
In terms of in labor force | age 16-19, the demographic groups most similar to Cambodians are Immigrants from Jordan (36.9%, a difference of 0.12%), Bermudan (36.9%, a difference of 0.13%), Immigrants from Saudi Arabia (37.0%, a difference of 0.15%), Immigrants from Kuwait (36.9%, a difference of 0.16%), and Yaqui (37.1%, a difference of 0.18%).
| Demographics | Rating | Rank | In Labor Force | Age 16-19 |
| Immigrants | Bulgaria | 81.6 /100 | #154 | Excellent 37.3% |
| Immigrants | Lithuania | 80.7 /100 | #155 | Excellent 37.2% |
| Kiowa | 80.4 /100 | #156 | Excellent 37.2% |
| Immigrants | Brazil | 76.5 /100 | #157 | Good 37.1% |
| Ute | 75.7 /100 | #158 | Good 37.1% |
| Yaqui | 74.4 /100 | #159 | Good 37.1% |
| Immigrants | Saudi Arabia | 73.9 /100 | #160 | Good 37.0% |
| Cambodians | 71.5 /100 | #161 | Good 37.0% |
| Immigrants | Jordan | 69.5 /100 | #162 | Good 36.9% |
| Bermudans | 69.3 /100 | #163 | Good 36.9% |
| Immigrants | Kuwait | 68.9 /100 | #164 | Good 36.9% |
| Yakama | 66.9 /100 | #165 | Good 36.9% |
| Immigrants | Western Africa | 66.7 /100 | #166 | Good 36.9% |
| Arabs | 63.6 /100 | #167 | Good 36.8% |
| Palestinians | 63.1 /100 | #168 | Good 36.8% |