Laotian vs Puget Sound Salish In Labor Force | Age > 16
COMPARE
Laotian
Puget Sound Salish
In Labor Force | Age > 16
In Labor Force | Age > 16 Comparison
Laotians
Puget Sound Salish
65.8%
IN LABOR FORCE | AGE > 16
97.4/ 100
METRIC RATING
112th/ 347
METRIC RANK
63.7%
IN LABOR FORCE | AGE > 16
0.0/ 100
METRIC RATING
294th/ 347
METRIC RANK
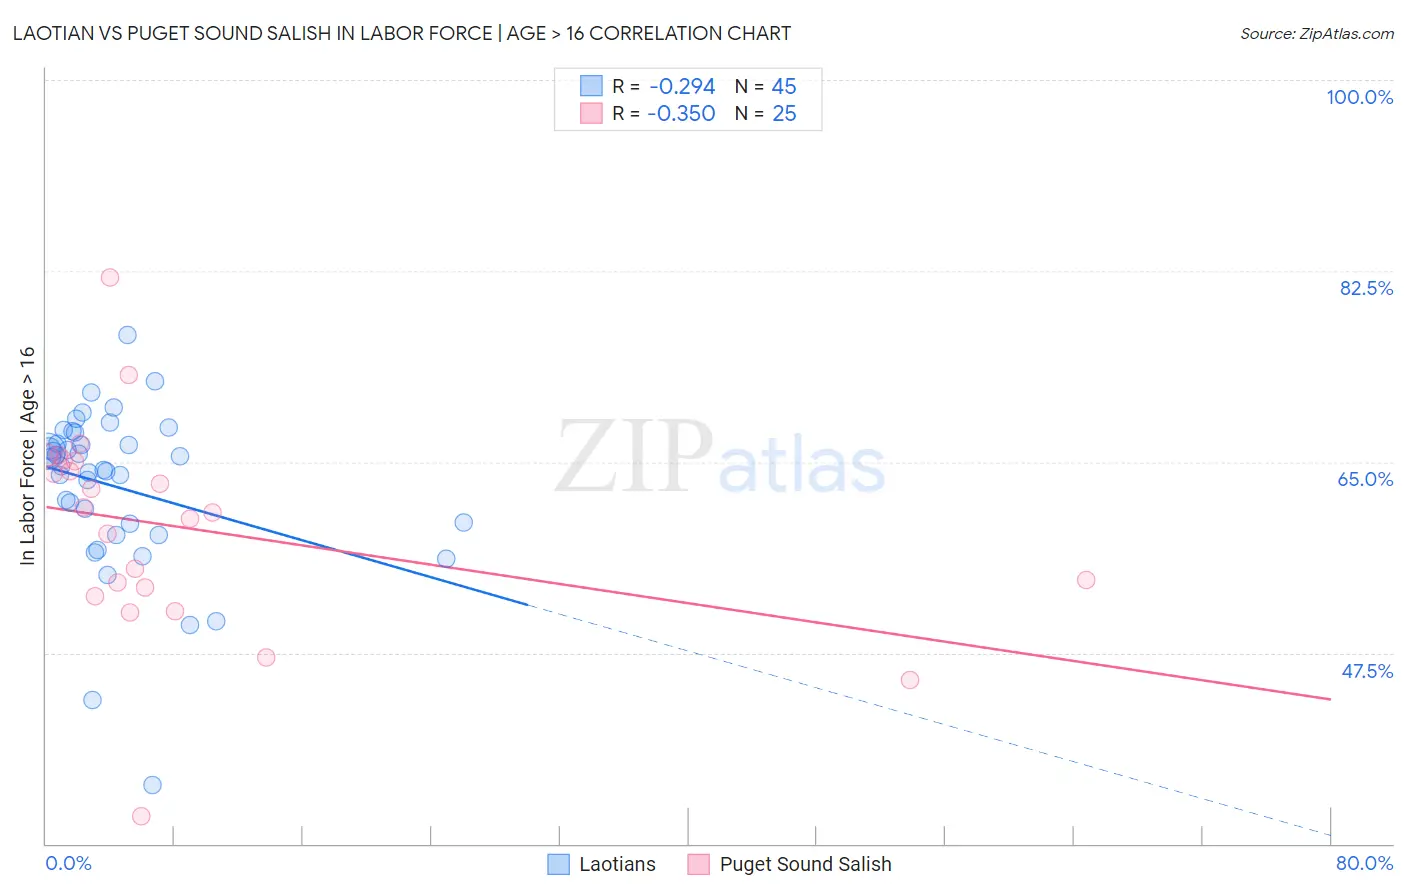
Laotian vs Puget Sound Salish In Labor Force | Age > 16 Correlation Chart
The statistical analysis conducted on geographies consisting of 224,862,184 people shows a weak negative correlation between the proportion of Laotians and labor force participation rate among population ages 16 and over in the United States with a correlation coefficient (R) of -0.294 and weighted average of 65.8%. Similarly, the statistical analysis conducted on geographies consisting of 46,155,746 people shows a mild negative correlation between the proportion of Puget Sound Salish and labor force participation rate among population ages 16 and over in the United States with a correlation coefficient (R) of -0.350 and weighted average of 63.7%, a difference of 3.2%.
In Labor Force | Age > 16 Correlation Summary
| Measurement | Laotian | Puget Sound Salish |
| Minimum | 35.4% | 32.5% |
| Maximum | 76.6% | 81.9% |
| Range | 41.2% | 49.4% |
| Mean | 62.7% | 58.9% |
| Median | 64.6% | 60.4% |
| Interquartile 25% (IQ1) | 58.8% | 53.1% |
| Interquartile 75% (IQ3) | 67.2% | 65.1% |
| Interquartile Range (IQR) | 8.3% | 12.0% |
| Standard Deviation (Sample) | 7.5% | 9.8% |
| Standard Deviation (Population) | 7.5% | 9.6% |
Similar Demographics by In Labor Force | Age > 16
Demographics Similar to Laotians by In Labor Force | Age > 16
In terms of in labor force | age > 16, the demographic groups most similar to Laotians are Immigrants from Honduras (65.8%, a difference of 0.020%), Pakistani (65.8%, a difference of 0.030%), Honduran (65.8%, a difference of 0.030%), Japanese (65.8%, a difference of 0.040%), and Immigrants from Indonesia (65.7%, a difference of 0.060%).
| Demographics | Rating | Rank | In Labor Force | Age > 16 |
| Colombians | 98.4 /100 | #105 | Exceptional 65.9% |
| Immigrants | Serbia | 98.1 /100 | #106 | Exceptional 65.8% |
| Immigrants | Poland | 98.1 /100 | #107 | Exceptional 65.8% |
| Immigrants | Spain | 98.0 /100 | #108 | Exceptional 65.8% |
| Immigrants | Japan | 98.0 /100 | #109 | Exceptional 65.8% |
| Japanese | 97.7 /100 | #110 | Exceptional 65.8% |
| Immigrants | Honduras | 97.5 /100 | #111 | Exceptional 65.8% |
| Laotians | 97.4 /100 | #112 | Exceptional 65.8% |
| Pakistanis | 97.1 /100 | #113 | Exceptional 65.8% |
| Hondurans | 97.1 /100 | #114 | Exceptional 65.8% |
| Immigrants | Indonesia | 96.8 /100 | #115 | Exceptional 65.7% |
| Argentineans | 96.7 /100 | #116 | Exceptional 65.7% |
| Immigrants | Iran | 96.6 /100 | #117 | Exceptional 65.7% |
| Immigrants | Thailand | 96.6 /100 | #118 | Exceptional 65.7% |
| Immigrants | France | 96.4 /100 | #119 | Exceptional 65.7% |
Demographics Similar to Puget Sound Salish by In Labor Force | Age > 16
In terms of in labor force | age > 16, the demographic groups most similar to Puget Sound Salish are English (63.7%, a difference of 0.030%), Immigrants from Canada (63.7%, a difference of 0.050%), Spanish American Indian (63.8%, a difference of 0.070%), Immigrants from North America (63.7%, a difference of 0.070%), and Nepalese (63.8%, a difference of 0.13%).
| Demographics | Rating | Rank | In Labor Force | Age > 16 |
| Scottish | 0.1 /100 | #287 | Tragic 63.9% |
| Spanish | 0.1 /100 | #288 | Tragic 63.9% |
| Celtics | 0.1 /100 | #289 | Tragic 63.8% |
| Hungarians | 0.1 /100 | #290 | Tragic 63.8% |
| Nepalese | 0.1 /100 | #291 | Tragic 63.8% |
| Spanish American Indians | 0.1 /100 | #292 | Tragic 63.8% |
| English | 0.1 /100 | #293 | Tragic 63.7% |
| Puget Sound Salish | 0.0 /100 | #294 | Tragic 63.7% |
| Immigrants | Canada | 0.0 /100 | #295 | Tragic 63.7% |
| Immigrants | North America | 0.0 /100 | #296 | Tragic 63.7% |
| Immigrants | Grenada | 0.0 /100 | #297 | Tragic 63.6% |
| Comanche | 0.0 /100 | #298 | Tragic 63.6% |
| Whites/Caucasians | 0.0 /100 | #299 | Tragic 63.6% |
| Immigrants | Azores | 0.0 /100 | #300 | Tragic 63.6% |
| Spanish Americans | 0.0 /100 | #301 | Tragic 63.6% |