Laotian vs Moroccan In Labor Force | Age > 16
COMPARE
Laotian
Moroccan
In Labor Force | Age > 16
In Labor Force | Age > 16 Comparison
Laotians
Moroccans
65.8%
IN LABOR FORCE | AGE > 16
97.4/ 100
METRIC RATING
112th/ 347
METRIC RANK
66.1%
IN LABOR FORCE | AGE > 16
99.5/ 100
METRIC RATING
81st/ 347
METRIC RANK
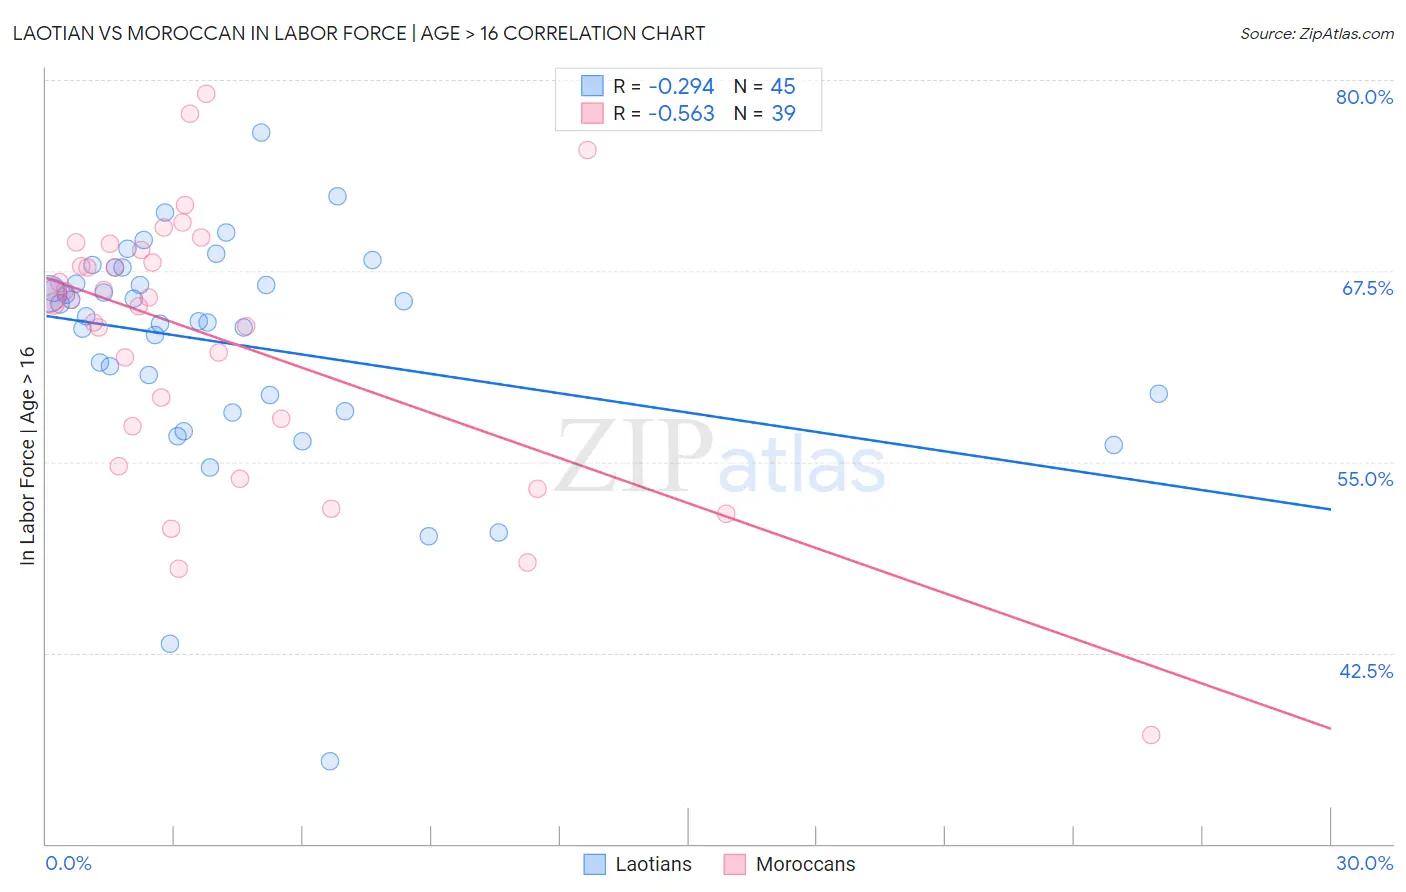
Laotian vs Moroccan In Labor Force | Age > 16 Correlation Chart
The statistical analysis conducted on geographies consisting of 224,862,184 people shows a weak negative correlation between the proportion of Laotians and labor force participation rate among population ages 16 and over in the United States with a correlation coefficient (R) of -0.294 and weighted average of 65.8%. Similarly, the statistical analysis conducted on geographies consisting of 201,807,372 people shows a substantial negative correlation between the proportion of Moroccans and labor force participation rate among population ages 16 and over in the United States with a correlation coefficient (R) of -0.563 and weighted average of 66.1%, a difference of 0.45%.
In Labor Force | Age > 16 Correlation Summary
| Measurement | Laotian | Moroccan |
| Minimum | 35.4% | 37.1% |
| Maximum | 76.6% | 79.1% |
| Range | 41.2% | 42.0% |
| Mean | 62.7% | 63.1% |
| Median | 64.6% | 65.7% |
| Interquartile 25% (IQ1) | 58.8% | 57.4% |
| Interquartile 75% (IQ3) | 67.2% | 68.9% |
| Interquartile Range (IQR) | 8.3% | 11.5% |
| Standard Deviation (Sample) | 7.5% | 8.9% |
| Standard Deviation (Population) | 7.5% | 8.7% |
Similar Demographics by In Labor Force | Age > 16
Demographics Similar to Laotians by In Labor Force | Age > 16
In terms of in labor force | age > 16, the demographic groups most similar to Laotians are Immigrants from Honduras (65.8%, a difference of 0.020%), Pakistani (65.8%, a difference of 0.030%), Honduran (65.8%, a difference of 0.030%), Japanese (65.8%, a difference of 0.040%), and Immigrants from Indonesia (65.7%, a difference of 0.060%).
| Demographics | Rating | Rank | In Labor Force | Age > 16 |
| Colombians | 98.4 /100 | #105 | Exceptional 65.9% |
| Immigrants | Serbia | 98.1 /100 | #106 | Exceptional 65.8% |
| Immigrants | Poland | 98.1 /100 | #107 | Exceptional 65.8% |
| Immigrants | Spain | 98.0 /100 | #108 | Exceptional 65.8% |
| Immigrants | Japan | 98.0 /100 | #109 | Exceptional 65.8% |
| Japanese | 97.7 /100 | #110 | Exceptional 65.8% |
| Immigrants | Honduras | 97.5 /100 | #111 | Exceptional 65.8% |
| Laotians | 97.4 /100 | #112 | Exceptional 65.8% |
| Pakistanis | 97.1 /100 | #113 | Exceptional 65.8% |
| Hondurans | 97.1 /100 | #114 | Exceptional 65.8% |
| Immigrants | Indonesia | 96.8 /100 | #115 | Exceptional 65.7% |
| Argentineans | 96.7 /100 | #116 | Exceptional 65.7% |
| Immigrants | Iran | 96.6 /100 | #117 | Exceptional 65.7% |
| Immigrants | Thailand | 96.6 /100 | #118 | Exceptional 65.7% |
| Immigrants | France | 96.4 /100 | #119 | Exceptional 65.7% |
Demographics Similar to Moroccans by In Labor Force | Age > 16
In terms of in labor force | age > 16, the demographic groups most similar to Moroccans are German Russian (66.1%, a difference of 0.010%), Immigrants from Jordan (66.1%, a difference of 0.010%), Central American (66.1%, a difference of 0.020%), Mongolian (66.1%, a difference of 0.030%), and Malaysian (66.1%, a difference of 0.050%).
| Demographics | Rating | Rank | In Labor Force | Age > 16 |
| Immigrants | Korea | 99.7 /100 | #74 | Exceptional 66.2% |
| Immigrants | Singapore | 99.7 /100 | #75 | Exceptional 66.2% |
| Immigrants | Malaysia | 99.6 /100 | #76 | Exceptional 66.1% |
| Immigrants | Moldova | 99.6 /100 | #77 | Exceptional 66.1% |
| Immigrants | Asia | 99.6 /100 | #78 | Exceptional 66.1% |
| Turks | 99.6 /100 | #79 | Exceptional 66.1% |
| Malaysians | 99.6 /100 | #80 | Exceptional 66.1% |
| Moroccans | 99.5 /100 | #81 | Exceptional 66.1% |
| German Russians | 99.4 /100 | #82 | Exceptional 66.1% |
| Immigrants | Jordan | 99.4 /100 | #83 | Exceptional 66.1% |
| Central Americans | 99.4 /100 | #84 | Exceptional 66.1% |
| Mongolians | 99.4 /100 | #85 | Exceptional 66.1% |
| South Americans | 99.4 /100 | #86 | Exceptional 66.0% |
| South American Indians | 99.4 /100 | #87 | Exceptional 66.0% |
| Bermudans | 99.3 /100 | #88 | Exceptional 66.0% |