Laotian vs Immigrants from Mexico 7th Grade
COMPARE
Laotian
Immigrants from Mexico
7th Grade
7th Grade Comparison
Laotians
Immigrants from Mexico
95.7%
7TH GRADE
6.8/ 100
METRIC RATING
222nd/ 347
METRIC RANK
90.7%
7TH GRADE
0.0/ 100
METRIC RATING
346th/ 347
METRIC RANK
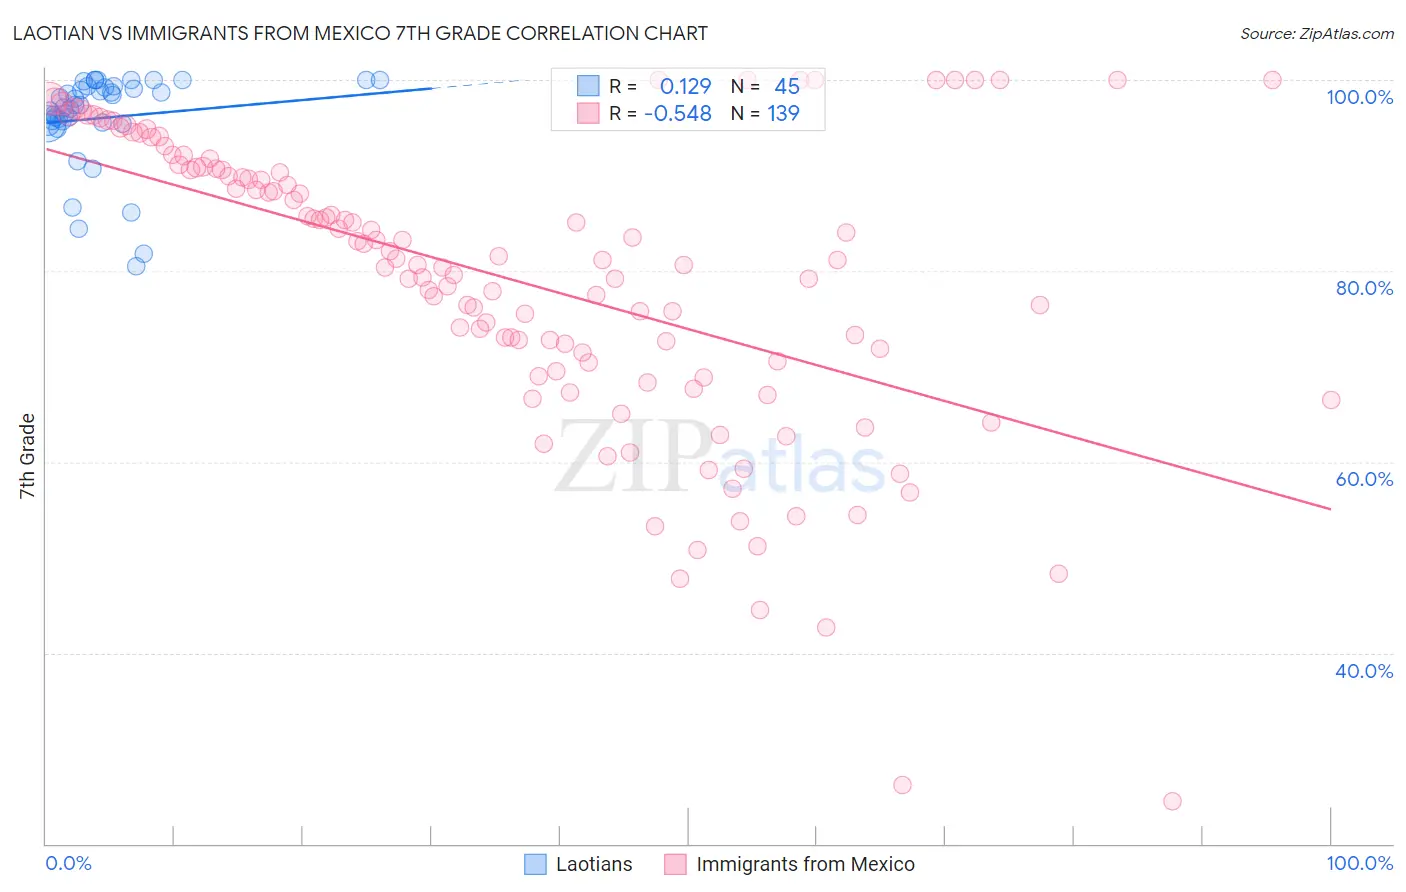
Laotian vs Immigrants from Mexico 7th Grade Correlation Chart
The statistical analysis conducted on geographies consisting of 224,856,886 people shows a poor positive correlation between the proportion of Laotians and percentage of population with at least 7th grade education in the United States with a correlation coefficient (R) of 0.129 and weighted average of 95.7%. Similarly, the statistical analysis conducted on geographies consisting of 513,767,254 people shows a substantial negative correlation between the proportion of Immigrants from Mexico and percentage of population with at least 7th grade education in the United States with a correlation coefficient (R) of -0.548 and weighted average of 90.7%, a difference of 5.4%.
7th Grade Correlation Summary
| Measurement | Laotian | Immigrants from Mexico |
| Minimum | 80.5% | 24.5% |
| Maximum | 100.0% | 100.0% |
| Range | 19.5% | 75.5% |
| Mean | 96.0% | 79.2% |
| Median | 97.4% | 81.2% |
| Interquartile 25% (IQ1) | 95.5% | 70.4% |
| Interquartile 75% (IQ3) | 99.3% | 90.9% |
| Interquartile Range (IQR) | 3.8% | 20.4% |
| Standard Deviation (Sample) | 4.9% | 15.5% |
| Standard Deviation (Population) | 4.8% | 15.5% |
Similar Demographics by 7th Grade
Demographics Similar to Laotians by 7th Grade
In terms of 7th grade, the demographic groups most similar to Laotians are Samoan (95.7%, a difference of 0.0%), Immigrants from Syria (95.7%, a difference of 0.0%), Immigrants from Oceania (95.7%, a difference of 0.0%), Subsaharan African (95.7%, a difference of 0.010%), and Immigrants from Southern Europe (95.7%, a difference of 0.020%).
| Demographics | Rating | Rank | 7th Grade |
| Spanish Americans | 9.3 /100 | #215 | Tragic 95.7% |
| Immigrants | Chile | 9.1 /100 | #216 | Tragic 95.7% |
| Immigrants | Pakistan | 9.0 /100 | #217 | Tragic 95.7% |
| Immigrants | Liberia | 8.1 /100 | #218 | Tragic 95.7% |
| Immigrants | Southern Europe | 7.9 /100 | #219 | Tragic 95.7% |
| Sub-Saharan Africans | 7.2 /100 | #220 | Tragic 95.7% |
| Samoans | 7.0 /100 | #221 | Tragic 95.7% |
| Laotians | 6.8 /100 | #222 | Tragic 95.7% |
| Immigrants | Syria | 6.7 /100 | #223 | Tragic 95.7% |
| Immigrants | Oceania | 6.7 /100 | #224 | Tragic 95.7% |
| Immigrants | Malaysia | 6.2 /100 | #225 | Tragic 95.6% |
| Immigrants | Eastern Asia | 5.8 /100 | #226 | Tragic 95.6% |
| Immigrants | Western Asia | 5.4 /100 | #227 | Tragic 95.6% |
| Immigrants | Eastern Africa | 5.1 /100 | #228 | Tragic 95.6% |
| Immigrants | Panama | 4.9 /100 | #229 | Tragic 95.6% |
Demographics Similar to Immigrants from Mexico by 7th Grade
In terms of 7th grade, the demographic groups most similar to Immigrants from Mexico are Immigrants from El Salvador (90.9%, a difference of 0.20%), Immigrants from Central America (91.0%, a difference of 0.27%), Spanish American Indian (90.3%, a difference of 0.48%), Immigrants from Guatemala (91.3%, a difference of 0.63%), and Salvadoran (91.5%, a difference of 0.79%).
| Demographics | Rating | Rank | 7th Grade |
| Immigrants | Armenia | 0.0 /100 | #333 | Tragic 92.7% |
| Immigrants | Yemen | 0.0 /100 | #334 | Tragic 92.6% |
| Mexican American Indians | 0.0 /100 | #335 | Tragic 92.6% |
| Immigrants | Honduras | 0.0 /100 | #336 | Tragic 92.5% |
| Immigrants | Latin America | 0.0 /100 | #337 | Tragic 92.2% |
| Central Americans | 0.0 /100 | #338 | Tragic 92.1% |
| Mexicans | 0.0 /100 | #339 | Tragic 91.9% |
| Yakama | 0.0 /100 | #340 | Tragic 91.7% |
| Guatemalans | 0.0 /100 | #341 | Tragic 91.7% |
| Salvadorans | 0.0 /100 | #342 | Tragic 91.5% |
| Immigrants | Guatemala | 0.0 /100 | #343 | Tragic 91.3% |
| Immigrants | Central America | 0.0 /100 | #344 | Tragic 91.0% |
| Immigrants | El Salvador | 0.0 /100 | #345 | Tragic 90.9% |
| Immigrants | Mexico | 0.0 /100 | #346 | Tragic 90.7% |
| Spanish American Indians | 0.0 /100 | #347 | Tragic 90.3% |