Laotian vs Kiowa In Labor Force | Age 16-19
COMPARE
Laotian
Kiowa
In Labor Force | Age 16-19
In Labor Force | Age 16-19 Comparison
Laotians
Kiowa
34.9%
IN LABOR FORCE | AGE 16-19
2.4/ 100
METRIC RATING
247th/ 347
METRIC RANK
37.2%
IN LABOR FORCE | AGE 16-19
80.4/ 100
METRIC RATING
156th/ 347
METRIC RANK
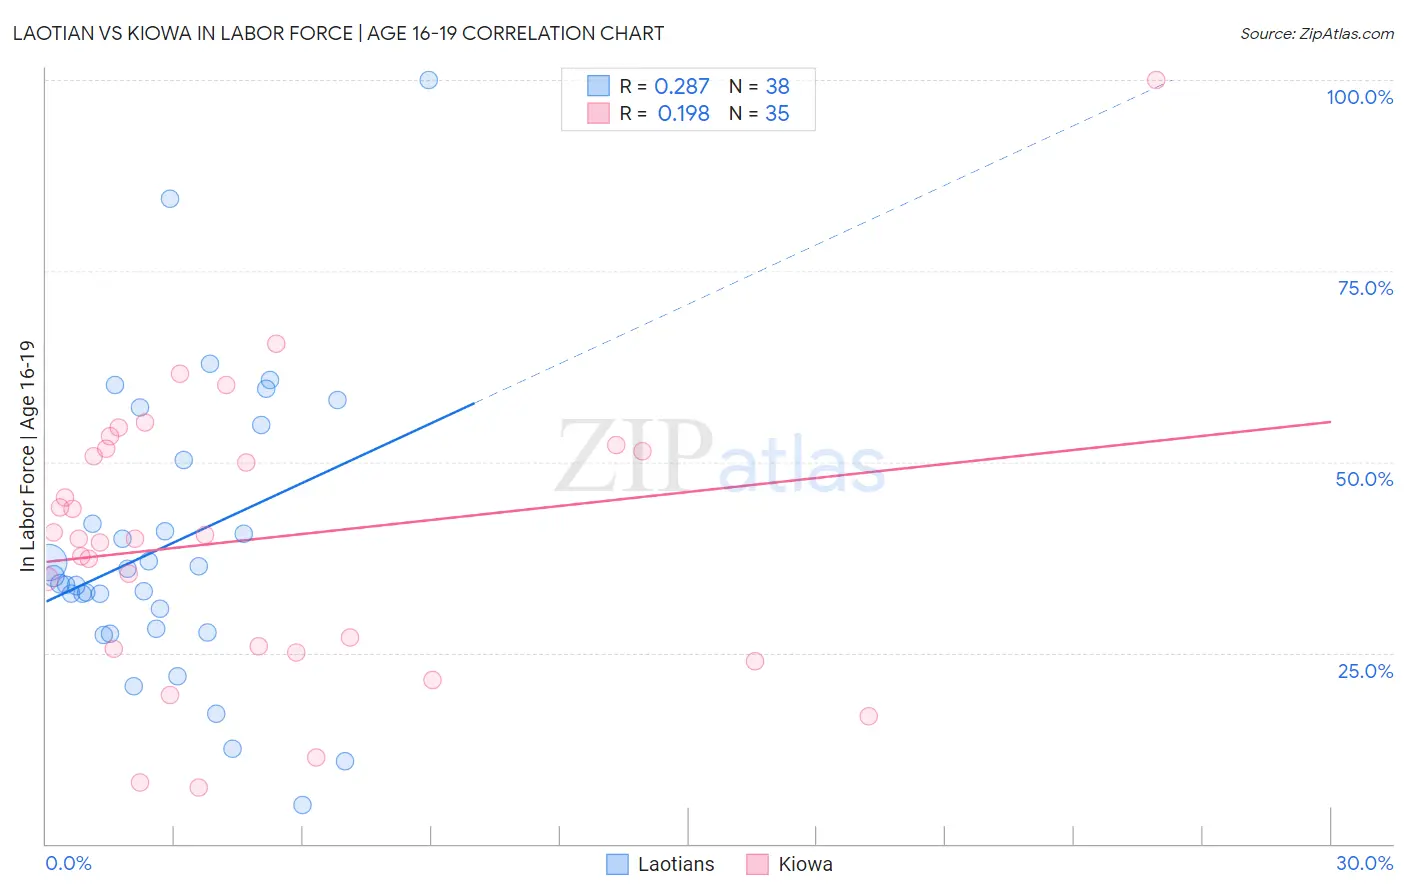
Laotian vs Kiowa In Labor Force | Age 16-19 Correlation Chart
The statistical analysis conducted on geographies consisting of 224,669,771 people shows a weak positive correlation between the proportion of Laotians and labor force participation rate among population between the ages 16 and 19 in the United States with a correlation coefficient (R) of 0.287 and weighted average of 34.9%. Similarly, the statistical analysis conducted on geographies consisting of 56,077,832 people shows a poor positive correlation between the proportion of Kiowa and labor force participation rate among population between the ages 16 and 19 in the United States with a correlation coefficient (R) of 0.198 and weighted average of 37.2%, a difference of 6.8%.
In Labor Force | Age 16-19 Correlation Summary
| Measurement | Laotian | Kiowa |
| Minimum | 5.1% | 7.4% |
| Maximum | 100.0% | 100.0% |
| Range | 94.9% | 92.6% |
| Mean | 39.1% | 39.9% |
| Median | 34.5% | 40.0% |
| Interquartile 25% (IQ1) | 28.1% | 25.5% |
| Interquartile 75% (IQ3) | 50.3% | 51.7% |
| Interquartile Range (IQR) | 22.2% | 26.2% |
| Standard Deviation (Sample) | 19.0% | 18.6% |
| Standard Deviation (Population) | 18.8% | 18.3% |
Similar Demographics by In Labor Force | Age 16-19
Demographics Similar to Laotians by In Labor Force | Age 16-19
In terms of in labor force | age 16-19, the demographic groups most similar to Laotians are Immigrants from Sri Lanka (34.9%, a difference of 0.010%), Immigrants from Greece (34.9%, a difference of 0.030%), Immigrants from Turkey (34.9%, a difference of 0.090%), Central American (34.8%, a difference of 0.090%), and Pueblo (34.9%, a difference of 0.11%).
| Demographics | Rating | Rank | In Labor Force | Age 16-19 |
| Immigrants | Central America | 3.0 /100 | #240 | Tragic 35.0% |
| Immigrants | Ireland | 2.9 /100 | #241 | Tragic 35.0% |
| Uruguayans | 2.6 /100 | #242 | Tragic 34.9% |
| Pueblo | 2.6 /100 | #243 | Tragic 34.9% |
| Immigrants | Turkey | 2.6 /100 | #244 | Tragic 34.9% |
| Immigrants | Greece | 2.4 /100 | #245 | Tragic 34.9% |
| Immigrants | Sri Lanka | 2.4 /100 | #246 | Tragic 34.9% |
| Laotians | 2.4 /100 | #247 | Tragic 34.9% |
| Central Americans | 2.2 /100 | #248 | Tragic 34.8% |
| Immigrants | Ukraine | 2.2 /100 | #249 | Tragic 34.8% |
| Immigrants | Pakistan | 2.0 /100 | #250 | Tragic 34.8% |
| Immigrants | Western Asia | 2.0 /100 | #251 | Tragic 34.8% |
| Immigrants | Chile | 2.0 /100 | #252 | Tragic 34.8% |
| Immigrants | Japan | 1.5 /100 | #253 | Tragic 34.7% |
| Bahamians | 1.4 /100 | #254 | Tragic 34.6% |
Demographics Similar to Kiowa by In Labor Force | Age 16-19
In terms of in labor force | age 16-19, the demographic groups most similar to Kiowa are Immigrants from Lithuania (37.2%, a difference of 0.020%), Immigrants from Bulgaria (37.3%, a difference of 0.10%), Arapaho (37.3%, a difference of 0.12%), Immigrants from Sierra Leone (37.3%, a difference of 0.27%), and Immigrants from Brazil (37.1%, a difference of 0.29%).
| Demographics | Rating | Rank | In Labor Force | Age 16-19 |
| Native Hawaiians | 85.0 /100 | #149 | Excellent 37.4% |
| Tsimshian | 84.7 /100 | #150 | Excellent 37.4% |
| Immigrants | Poland | 84.4 /100 | #151 | Excellent 37.3% |
| Immigrants | Sierra Leone | 83.6 /100 | #152 | Excellent 37.3% |
| Arapaho | 81.8 /100 | #153 | Excellent 37.3% |
| Immigrants | Bulgaria | 81.6 /100 | #154 | Excellent 37.3% |
| Immigrants | Lithuania | 80.7 /100 | #155 | Excellent 37.2% |
| Kiowa | 80.4 /100 | #156 | Excellent 37.2% |
| Immigrants | Brazil | 76.5 /100 | #157 | Good 37.1% |
| Ute | 75.7 /100 | #158 | Good 37.1% |
| Yaqui | 74.4 /100 | #159 | Good 37.1% |
| Immigrants | Saudi Arabia | 73.9 /100 | #160 | Good 37.0% |
| Cambodians | 71.5 /100 | #161 | Good 37.0% |
| Immigrants | Jordan | 69.5 /100 | #162 | Good 36.9% |
| Bermudans | 69.3 /100 | #163 | Good 36.9% |