Laotian vs Croatian Cognitive Disability
COMPARE
Laotian
Croatian
Cognitive Disability
Cognitive Disability Comparison
Laotians
Croatians
17.3%
COGNITIVE DISABILITY
50.0/ 100
METRIC RATING
174th/ 347
METRIC RANK
16.4%
COGNITIVE DISABILITY
99.9/ 100
METRIC RATING
23rd/ 347
METRIC RANK
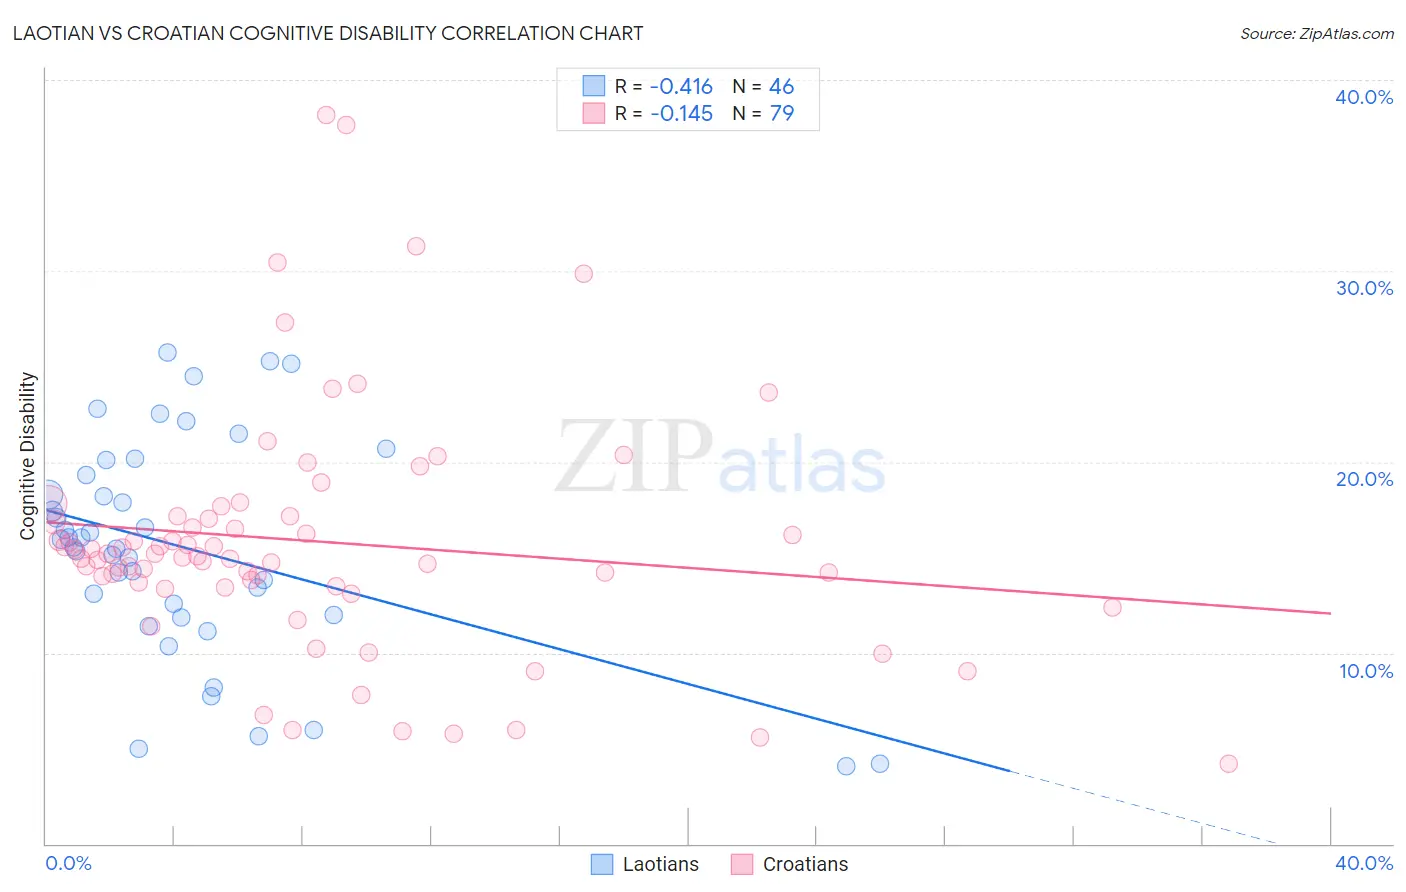
Laotian vs Croatian Cognitive Disability Correlation Chart
The statistical analysis conducted on geographies consisting of 224,855,635 people shows a moderate negative correlation between the proportion of Laotians and percentage of population with cognitive disability in the United States with a correlation coefficient (R) of -0.416 and weighted average of 17.3%. Similarly, the statistical analysis conducted on geographies consisting of 375,711,663 people shows a poor negative correlation between the proportion of Croatians and percentage of population with cognitive disability in the United States with a correlation coefficient (R) of -0.145 and weighted average of 16.4%, a difference of 5.6%.
Cognitive Disability Correlation Summary
| Measurement | Laotian | Croatian |
| Minimum | 4.0% | 4.2% |
| Maximum | 25.7% | 38.2% |
| Range | 21.7% | 34.0% |
| Mean | 15.5% | 15.8% |
| Median | 15.7% | 15.1% |
| Interquartile 25% (IQ1) | 12.0% | 13.5% |
| Interquartile 75% (IQ3) | 19.3% | 17.1% |
| Interquartile Range (IQR) | 7.3% | 3.6% |
| Standard Deviation (Sample) | 5.7% | 6.4% |
| Standard Deviation (Population) | 5.6% | 6.3% |
Similar Demographics by Cognitive Disability
Demographics Similar to Laotians by Cognitive Disability
In terms of cognitive disability, the demographic groups most similar to Laotians are Immigrants from Northern Africa (17.3%, a difference of 0.010%), Tsimshian (17.3%, a difference of 0.010%), Shoshone (17.3%, a difference of 0.020%), Ute (17.3%, a difference of 0.030%), and Spanish (17.3%, a difference of 0.030%).
| Demographics | Rating | Rank | Cognitive Disability |
| Immigrants | Syria | 63.5 /100 | #167 | Good 17.2% |
| Immigrants | Immigrants | 62.5 /100 | #168 | Good 17.2% |
| Immigrants | Portugal | 61.8 /100 | #169 | Good 17.2% |
| Ecuadorians | 59.6 /100 | #170 | Average 17.2% |
| Tlingit-Haida | 59.4 /100 | #171 | Average 17.2% |
| Immigrants | Turkey | 56.7 /100 | #172 | Average 17.2% |
| Immigrants | Northern Africa | 50.2 /100 | #173 | Average 17.3% |
| Laotians | 50.0 /100 | #174 | Average 17.3% |
| Tsimshian | 49.8 /100 | #175 | Average 17.3% |
| Shoshone | 49.2 /100 | #176 | Average 17.3% |
| Ute | 49.1 /100 | #177 | Average 17.3% |
| Spanish | 48.9 /100 | #178 | Average 17.3% |
| Sioux | 48.6 /100 | #179 | Average 17.3% |
| Pakistanis | 43.9 /100 | #180 | Average 17.3% |
| Immigrants | Guyana | 42.9 /100 | #181 | Average 17.3% |
Demographics Similar to Croatians by Cognitive Disability
In terms of cognitive disability, the demographic groups most similar to Croatians are Immigrants from South Central Asia (16.4%, a difference of 0.030%), Immigrants from Argentina (16.4%, a difference of 0.030%), Luxembourger (16.4%, a difference of 0.060%), Immigrants from Croatia (16.4%, a difference of 0.10%), and Immigrants from Pakistan (16.4%, a difference of 0.12%).
| Demographics | Rating | Rank | Cognitive Disability |
| Eastern Europeans | 100.0 /100 | #16 | Exceptional 16.3% |
| Immigrants | North Macedonia | 100.0 /100 | #17 | Exceptional 16.3% |
| Immigrants | Northern Europe | 100.0 /100 | #18 | Exceptional 16.3% |
| Immigrants | Bolivia | 100.0 /100 | #19 | Exceptional 16.3% |
| Bulgarians | 100.0 /100 | #20 | Exceptional 16.3% |
| Immigrants | Cuba | 100.0 /100 | #21 | Exceptional 16.3% |
| Immigrants | South Central Asia | 99.9 /100 | #22 | Exceptional 16.4% |
| Croatians | 99.9 /100 | #23 | Exceptional 16.4% |
| Immigrants | Argentina | 99.9 /100 | #24 | Exceptional 16.4% |
| Luxembourgers | 99.9 /100 | #25 | Exceptional 16.4% |
| Immigrants | Croatia | 99.9 /100 | #26 | Exceptional 16.4% |
| Immigrants | Pakistan | 99.9 /100 | #27 | Exceptional 16.4% |
| Poles | 99.9 /100 | #28 | Exceptional 16.4% |
| Filipinos | 99.9 /100 | #29 | Exceptional 16.4% |
| Czechs | 99.9 /100 | #30 | Exceptional 16.4% |