Laotian vs Immigrants from Nepal In Labor Force | Age 16-19
COMPARE
Laotian
Immigrants from Nepal
In Labor Force | Age 16-19
In Labor Force | Age 16-19 Comparison
Laotians
Immigrants from Nepal
34.9%
IN LABOR FORCE | AGE 16-19
2.4/ 100
METRIC RATING
247th/ 347
METRIC RANK
38.3%
IN LABOR FORCE | AGE 16-19
97.8/ 100
METRIC RATING
118th/ 347
METRIC RANK
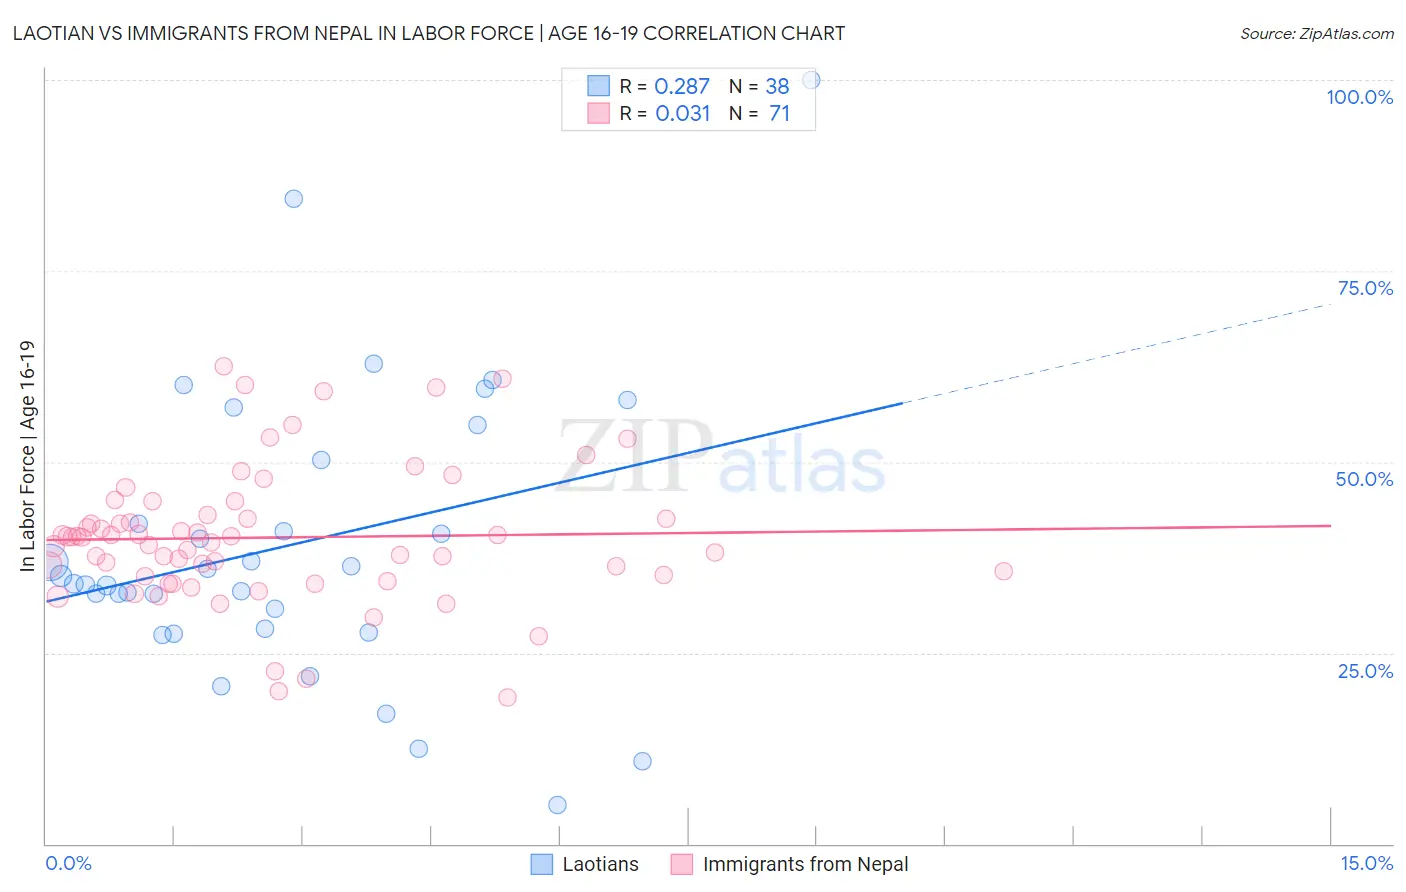
Laotian vs Immigrants from Nepal In Labor Force | Age 16-19 Correlation Chart
The statistical analysis conducted on geographies consisting of 224,669,771 people shows a weak positive correlation between the proportion of Laotians and labor force participation rate among population between the ages 16 and 19 in the United States with a correlation coefficient (R) of 0.287 and weighted average of 34.9%. Similarly, the statistical analysis conducted on geographies consisting of 186,763,001 people shows no correlation between the proportion of Immigrants from Nepal and labor force participation rate among population between the ages 16 and 19 in the United States with a correlation coefficient (R) of 0.031 and weighted average of 38.3%, a difference of 9.9%.
In Labor Force | Age 16-19 Correlation Summary
| Measurement | Laotian | Immigrants from Nepal |
| Minimum | 5.1% | 19.2% |
| Maximum | 100.0% | 62.5% |
| Range | 94.9% | 43.3% |
| Mean | 39.1% | 40.1% |
| Median | 34.5% | 40.1% |
| Interquartile 25% (IQ1) | 28.1% | 35.0% |
| Interquartile 75% (IQ3) | 50.3% | 43.1% |
| Interquartile Range (IQR) | 22.2% | 8.1% |
| Standard Deviation (Sample) | 19.0% | 9.0% |
| Standard Deviation (Population) | 18.8% | 9.0% |
Similar Demographics by In Labor Force | Age 16-19
Demographics Similar to Laotians by In Labor Force | Age 16-19
In terms of in labor force | age 16-19, the demographic groups most similar to Laotians are Immigrants from Sri Lanka (34.9%, a difference of 0.010%), Immigrants from Greece (34.9%, a difference of 0.030%), Immigrants from Turkey (34.9%, a difference of 0.090%), Central American (34.8%, a difference of 0.090%), and Pueblo (34.9%, a difference of 0.11%).
| Demographics | Rating | Rank | In Labor Force | Age 16-19 |
| Immigrants | Central America | 3.0 /100 | #240 | Tragic 35.0% |
| Immigrants | Ireland | 2.9 /100 | #241 | Tragic 35.0% |
| Uruguayans | 2.6 /100 | #242 | Tragic 34.9% |
| Pueblo | 2.6 /100 | #243 | Tragic 34.9% |
| Immigrants | Turkey | 2.6 /100 | #244 | Tragic 34.9% |
| Immigrants | Greece | 2.4 /100 | #245 | Tragic 34.9% |
| Immigrants | Sri Lanka | 2.4 /100 | #246 | Tragic 34.9% |
| Laotians | 2.4 /100 | #247 | Tragic 34.9% |
| Central Americans | 2.2 /100 | #248 | Tragic 34.8% |
| Immigrants | Ukraine | 2.2 /100 | #249 | Tragic 34.8% |
| Immigrants | Pakistan | 2.0 /100 | #250 | Tragic 34.8% |
| Immigrants | Western Asia | 2.0 /100 | #251 | Tragic 34.8% |
| Immigrants | Chile | 2.0 /100 | #252 | Tragic 34.8% |
| Immigrants | Japan | 1.5 /100 | #253 | Tragic 34.7% |
| Bahamians | 1.4 /100 | #254 | Tragic 34.6% |
Demographics Similar to Immigrants from Nepal by In Labor Force | Age 16-19
In terms of in labor force | age 16-19, the demographic groups most similar to Immigrants from Nepal are Chickasaw (38.3%, a difference of 0.010%), Assyrian/Chaldean/Syriac (38.3%, a difference of 0.020%), Colville (38.3%, a difference of 0.060%), Bulgarian (38.3%, a difference of 0.070%), and Ukrainian (38.3%, a difference of 0.10%).
| Demographics | Rating | Rank | In Labor Force | Age 16-19 |
| Crow | 98.5 /100 | #111 | Exceptional 38.5% |
| Immigrants | Scotland | 98.5 /100 | #112 | Exceptional 38.5% |
| Sub-Saharan Africans | 98.3 /100 | #113 | Exceptional 38.4% |
| Hawaiians | 98.2 /100 | #114 | Exceptional 38.4% |
| Bulgarians | 97.9 /100 | #115 | Exceptional 38.3% |
| Colville | 97.9 /100 | #116 | Exceptional 38.3% |
| Chickasaw | 97.8 /100 | #117 | Exceptional 38.3% |
| Immigrants | Nepal | 97.8 /100 | #118 | Exceptional 38.3% |
| Assyrians/Chaldeans/Syriacs | 97.8 /100 | #119 | Exceptional 38.3% |
| Ukrainians | 97.6 /100 | #120 | Exceptional 38.3% |
| Ethiopians | 97.4 /100 | #121 | Exceptional 38.2% |
| Guamanians/Chamorros | 97.4 /100 | #122 | Exceptional 38.2% |
| Seminole | 96.7 /100 | #123 | Exceptional 38.1% |
| Immigrants | England | 96.4 /100 | #124 | Exceptional 38.1% |
| Immigrants | Africa | 96.1 /100 | #125 | Exceptional 38.0% |